Reversal Magic

Agisthos said:
You actually find the reversal points just by using a ruler and drawing 2 lines (or using a charting draw tool). The point where the 2 lines meet is extrapolated into the future and this is your reversal point.

It reminds me to one of the methods discussed in the book " Trading Advantage" from Joe Duffy.

machiavelli
 
You actually find the reversal points just by using a ruler and drawing 2 lines (or using a charting draw tool). The point where the 2 lines meet is extrapolated into the future and this is your reversal point


imo..this is a good way to trade triangle break outs before the apex. Draw a verticle line at the apex as this often provides an attempt at reversal
 
I think that one came from me first. But I must have read it somewhere first..cant remeber where

but then again Bonsai has been trading since the begining of time (sorry Bonsai :) )so he must have come across it way before I did
 
Last edited:
I've just bought Reversal Magix, after seeing Skimbleshanks' comments here. The author replied promptly and helpfully to my email enquiries (made on Sunday) and sent the first half of the first book (there are 3 books) by email exactly as advertised. So far I agree entirely with Skimbleshanks' view: - looks very interesting and very well written, and so far I'm certainly not sorry I've bought it.

I'll post again after I've received the full CD by mail with all 3 books on it (but that might not be for about 3 weeks because I'm going away soon).

I'm not sure how much a "review" from me at that stage will be worth, but I'll offer what I can, and more after I've had some real experience with it all.
 
sorry H, my mistake. i just remember it from a few of his charts. was uncannily accurate. might merit further investigation.
 
Evening Skim,

ref : Constance Browns book, have a look in Chapter 4, using dominant trend lines to forecast significant reversal points .She shows how to use price trend lines and osillator trend lines .

cheers

Triplepack
 
Hi triplepack

The chart on page 54 is the nearest - it's not the same, but there are similarities. And RM is an awful lot simpler than the 9 point square, on which the chart on page 54 is based.

I've got a lot on my plate right now, so I'll try and find the time to read chapter 4 over the next few days and see if there's anything else which is similar to RM. I bought Constance's book yonks ago and never got round to reading it, although I did have a brief look at a few charts!

I took a quick look at the intro to BM and the author says that he has tried Gann, Elliott and much more, and did the Wolfe Wave course, and while he derived some valuable information from each, "in the real scheme of things they all led to disappointments."

It's not Delta. The whole market is based on cycles, so everything used in trading can be traced back to cycles at some point.

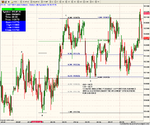
It's a simple pattern which appears on a bar chart which indicates a reversal point. You need to use discretion to and practice to know which are the correct points to use, but that just takes time and dedication.
 
Hi Skim ,
I think your referring to Gann on the 9 point square, maybe , if so I dont think she is. She is using that diagram to prime your vision to identify trend lines.
I had Constance Browns book for a while , first time I read it I just couldn't follow most of it. I picked it up
a year or so later with a little experience under the belt and found a couple of nuggets in it. One was using RSI for price projection. ( Anybody use this with good results ?) I found that very useful. Like reversal magic, I presume not in the mainstream of TA but with it's own merits.

cheers

Triplepack.
 
Sorry, triplepack - I meant The Nine Squares, not Nine Point Square. I got the two mixed up - even though I was looking at the diagram on page 50 as I was typing the response! Eyes, brain and fingers are not in sync. LOL

triplepack said:
I found that very useful. Like reversal magic, I presume not in the mainstream of TA but with it's own merits.
I've found that anything in the mainstream of TA is of very little value because it's in every book and covered on every course, but tucked away here and there in books are hidden gems. Unfortunately it's taken me quite a few years to be able to sort the wheat from the chaff. And boy oh boy do I have a lot of chaff on my bookshelves and in my head.
 
Skim I am taking a guess but it sounds like BBG's 1:1 ratio's for example the 1120 reversal point on the 15th sept was a 1:1 target of 10.75, an ideal place to go long with small risk.
 
anmolway.
I have seen ref to 1:1 ratio before on several posts on T2W and wondered what it is referring to .
Could yo please explain what it means and give me an example of how you calculate the target
using the 1:1 ratio.
I can refer to the S&P chart for the 15th Sep if this will help you explain what you mean.
Thanks a lot
 
Skim, is this the kind of thing that reversal magic offers?

Fluke and Bramble hope this 1:1 chart explains what I mean.
 

Attachments

  • snapshot-50.png
    snapshot-50.png
    147.5 KB · Views: 1,278
right guys, can anyone see what im doing here..???


not the most accurate chart in the world, but i had a wee look at a current , longer term chart.

draw lines accross the two most recent decending tops, and the two most recent ascending lows.

where the lines meet seems to mark relatively significant turning points.

this is an extension of what hooya mentioned before, and if it is too close to any copyrighted material i will remove it. just looks as though it has potential. FYI i havent read anything of this reversal magic text.

FC
 

Attachments

  • turning points1.jpg
    turning points1.jpg
    131.8 KB · Views: 2,088
hmm, not so accurate on the daily chart.

perhaps could be used as a confirmation of support/resistance.

does look as though we have reached a recent top though and are turning down to have another go at last months low...
 

Attachments

  • turning points2.jpg
    turning points2.jpg
    149.3 KB · Views: 1,235
FC,
Thats what Skim and I were discussing earlier, You can look for other trends in indicators such as RSI.

check out Connie Browns Technical analysis for proffesionals this is one of her tools which she uses
and describes.

anmolway , is the way you are looking at these reversal anything similar to Gartley's butterflies etc.. The further study of his patterns use fibs such as 0.612 and 1.612 to predict further moves harmonically. They seems to work when they appear. Use of the ab=cd legs comes up on these patterns .


Triplepack
 
I'll have closer look at reversal magic over the weekend.... (Caroline permitting :)) )

As for 1:1 there a part of elliott theory for corrective relationships between waves of similar degree.. Jiller popularised the "measured move" back in the 60's..

BTW most of TTW content has been posted either on here or Tac just read between the lines of either mine or TomH (SUNSEEKERS) post.. :eek: :)

CJ
 
anmolway:

No, it's nothing to do with 1:1 ratios, or breakouts. Can't really say any more without giving the game away, and that wouldn't be any fun, would it? LOL
 
SKIM,
you mentioned that you bought it 2 years ago, does the method still work as well as it did then or has the effectiveness changed as with the market.
 
Top