Reuters - Short term Recovery?

Madog

Junior member
Messages
37
Likes
0
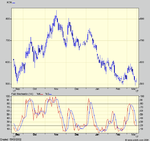
Ive been short on Reuters for a while but recently the downtrend which goes back to the start of the year has been broken quite convinsingly.

Could anyone offer an opinion on how they read the chart?

Sorry but I'm still getting difficulties attaching charts

Thanks

Madog
 
Hi Madog,

Here's a chart of RTR from the www.investtech.com website. If you're still having problems email me at [email protected] and I'll help you get to grips with attaching charts.
 

Attachments

  • rtr1.gif
    rtr1.gif
    12.8 KB · Views: 389
RTR is one of my favourites and what I see is:

1. Long term supply (down) trendline going back to Sept 2000. Lots of points of contact so it is pretty strong.
2. The short term supply line HAS been broken and a short term upward trendline confirmed after a pullback.
3. Volume is not great
4. Double bottom pattern formed - if completed would give a target around 1180!!
5. Lots of lines of resistance - problem which is significant; I'm looking at one at 614 at the minute.

I'm not sure where this is leading, except that there is a short term recovery in place as you suggested. The more interesting thing is whats going to happen when these lines meet in a few weeks. If (big if) sentiment turns then we may see the long term trend broken; then it might get exciting.
 
OK - So RTR couldn't break through the Fib level at 580 and has gone back to the long term resistance at around 500 and broken the short term demand line.

It has hit the bottom of the Bollinger

Where now? The only thing I can see for certain is that in around 10 to 12 weeks that long term supply line is going to exert real pressure and only then will we see whether or not RTR can break out to the upside. If not...?

Until then I shall be watching for a non trending cycle pattern
between 500 and 580. If this does not happen then something else will - plan B.

Any body swing trade this?
 
Treble bottom now at 513p. My charts suggest it may bounce but I would not wish to be premature. All my indicators still say sell..And volume is very high sugesting a degree of conflict of views....
 
Well here is the daily chart...as Madf says triple bottom, hammer followed by a doji, stochastics oversold at 20, consolidation at lower bolinger band (not shown on the chart)...all typical signs of bottoming, looks like up more likely than down, still a bit early to call it a buy though certainly not shortable at this level...

Riz
 

Attachments

  • rtr.png
    rtr.png
    12.8 KB · Views: 393
Top