You are using an out of date browser. It may not display this or other websites correctly.
You should upgrade or use an alternative browser.
You should upgrade or use an alternative browser.
frugi
1
- Messages
- 1,843
- Likes
- 133
Volume that is above the average volume during the consolidation. Above average volume suggests a shift in the consensus of value between market participants. If it pulls back to the top of the rectangle on low volume after breaking out that can add to the quality of the buy signal. If it pulls back on equal volume to the breakout be cautious: it could be a fake break.
Low volume on the breakout suggests lack of conviction and perhaps a running of buy stops that the big boys know will be lurking just above resistance.
Mind you, brutally high volume on the breakout might actually suggest a blow off climactic top. Everyone buys the breakout, there is nobody left to buy, so the path of least resistance is then down.
Skim, don't suppose you fancy translating this from textbook into real world "stuff that actually works"? 🙂
Hi Frugi,
Are saying a quality rectangular bullish breakout should be supported by above average volume followed by a pull back on low volume to the top of the rectangle and then the stock will reverse and breakout out again ?
What if the stock does not pull back ?
Ambi007
Are saying a quality rectangular bullish breakout should be supported by above average volume followed by a pull back on low volume to the top of the rectangle and then the stock will reverse and breakout out again ?
What if the stock does not pull back ?
Ambi007
- Messages
- 2,325
- Likes
- 17
Hmmm ... that's difficult, because it is text book stuff.
What I look for is the lowest volume bar, then look at the price action on the following bar. (Lull before the storm, so to speak.) This is often the start of the actual 'breakout' because it signifies big boys coming into the market. It often happens at the opposite end to the breakout, and that's why you're far too late 'buying' a breakout - you need to already be long at the point of breakout so that if it fails, you can exit without a loss.
What I look for is the lowest volume bar, then look at the price action on the following bar. (Lull before the storm, so to speak.) This is often the start of the actual 'breakout' because it signifies big boys coming into the market. It often happens at the opposite end to the breakout, and that's why you're far too late 'buying' a breakout - you need to already be long at the point of breakout so that if it fails, you can exit without a loss.
Normally (not always) the break of the rectangle will be in the direction of entry .
Once it breaks.. a pull back should not exceed the 38.2 % point of the rectangle area range.
If it does you must reassess the break..( In a very tight price range you can apply 61.8% point of the rectangle range as the MOB point).
CJ
Once it breaks.. a pull back should not exceed the 38.2 % point of the rectangle area range.
If it does you must reassess the break..( In a very tight price range you can apply 61.8% point of the rectangle range as the MOB point).
CJ
frugi
1
- Messages
- 1,843
- Likes
- 133
Thanks folks.
Amarjit,
As you might imagine you don't always have the pleasure of a lower volume pullback - sometimes the price just carries on racing up/down in the direction of the breakout. I prefer to enter on such a pullback because the risk is lower (closer stop loss) and the pullback (as long as it does not exceed previous resistance or the areas a320 mentions) confirms the breakout by way of its weakness. But if the breakout is really savage then just going with it is often not a bad plan!
Judging when, if and where to enter and place your stop is all part of the skill of trading, which one day I might possess; the two above already have it in Airbusloads, I believe ;-)
frugi
1
- Messages
- 1,843
- Likes
- 133
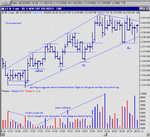
I like this especially rectangular chart...reinforces Skim's point about getting in well before the breakout by looking at volume and bar patterns. Trading the breakout up would have been profitable anyway, but why deny yourself a couple of extra points and less overall risk? The preceding false breakout down was a bit mean but the bar closes above support at which point an entry could certainly be considered.
No doubt I'd have gone short on the spook out bar and desperately moved my stop to the top of the consolidation when it bounced up then doubled down!
No doubt I'd have gone short on the spook out bar and desperately moved my stop to the top of the consolidation when it bounced up then doubled down!
Attachments
Last edited:
- Messages
- 2,325
- Likes
- 17
sandpiper
Well-known member
- Messages
- 458
- Likes
- 54
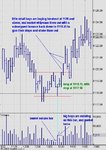
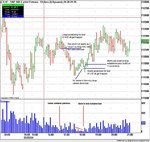
Skimbleshanks said:Here's a quick chart to show what I mean about using the volume to predict the approaching breakout, and where to get in.
Skim,
Classic example. Looked like sell program hit equities on that 01:20 pm doji reversal bar that you highlighted and the index arb boys just sat there on the bid and soaked everything up that retail sold down to 1117.75. Not that the whys and wherefores matter that much. And I certainly don't want to detract from your point about pre-emptive entry (especially your point about the low volume bars which is another gem), just thought it was one of the more interesting bars of the day. A perfect 1-2-3 reversal on the 5 minute chart as well.
The short from earlier in the day (shown on chart) was a bit messy but I highlighted it simply because, without your earlier tip about low volume bars (you mentioned it yonks ago) I would have never have picked up on it. The earlier congestion between between 1123 and 1121 would certainly have had me looking to get short but that little two bar price/volume pattern that you highlight has given me extra confidence in those entries.
Many thanks.
Attachments
- Messages
- 2,325
- Likes
- 17
That very low volume stuff also works a treat on 1 minute bars, which is where I first used it. I was able to pick the specific one minute bar that the market turned on every pullback when trading the Dow. I would know within 15 seconds of the start of the bar, and was able to jump on board. It was the only way I knew how to beat the SB companies' software programs. Not sure if it still does though! Hershey was the chap who taught me that particular little trick, and he reckoned he used it to good effect on end-of-day charts too.
But whatever you use, the key to success is in being in the trade before the breakout, and not at the point of breakout, which is what is taught in books and on courses. It requires subjective skill, and you need to be agile and quick thinking to get out if the breakout is faded. But on my example you can see that even if the breakout fails, you still get out at a slight profit at best, or breakeven point at the worst.
On my chart example above, the large volume bar after the breakout is where the majority of retail buyers enter, only to see the market move against them immediately - I would suggest that this high volume bar coincides with some crossover of lines on an indicator that the little retail boys are using. Indicators! 🙄
F
ford
Neat trick..
I have one question. Both examples all co-incide with doji's on the bar where volume increases from the lull. I'm just wondering if this is crucial to the trick, as on my charts both of the instances the bars arent doji's, just 1 tick off.
So when you go through the decission making process and analyse what is on the screen does the doji play a major role in entering or not?
Thank you for the contributions 😎
- Messages
- 2,325
- Likes
- 17
The doji isn't really that important - it's more the bigger picture that's important. The data suppliers have to ensure their data transmission is no more than 3 seconds out from the exchange; so that means that at the beginning and end of bars those 3 seconds can mean the difference of a tick or two, so you have to take it all with a pinch of salt. That's why you've not got dojis, but I have!
The best dojis are the ones with the open and closes in the middle of the bar, and the bar is a long one, because they signify indecision. Sandpiper's example shows a nice doji coinciding with a very low volume bar.
The doji in my example was a puny little chap, and you can't and shouldn't read too much into them because the bar is short. You then look at the bigger picture and the volume, to get an idea of whether that bar is the turn. Then if you're certain, go in at the open of the next bar, if you're not so certain, go in at the break of the doji's high. With practice you'll realise that the sooner you get in, the sooner you will get out if it goes pear shaped, as your entry point is a lot closer to your exit point.
sandpiper
Well-known member
- Messages
- 458
- Likes
- 54
ford said:Neat trick..
I have one question. Both examples all co-incide with doji's on the bar where volume increases from the lull. I'm just wondering if this is crucial to the trick, as on my charts both of the instances the bars arent doji's, just 1 tick off.
So when you go through the decission making process and analyse what is on the screen does the doji play a major role in entering or not?
Thank you for the contributions 😎
ford,
The way I've come to look at it, the doji is kind of important but not crucial, i.e. ditto. BTW.. don't know what charting package you are using, but if your bars are out you could try synchroning your pc clock via these atomic clock sites... might make a difference).
However (based entirely on another gem Skim mentioned yonks ago... which I hope she doesn't mind me repeating 😉) if you watched those two doji bars forming at the time in conjunction with the volume as it increased and you should have seen the volume increasing above where the doji eventually closed (1st example) and below the where the doji eventually closed (2nd example). In both cases there was significant volume (not huge mind you) without any dramatic movement in price. Somebody was sitting there on the offer (example 1) on the bid (second example) happily taking everything. Who is this more likely to be? Retail or the big boys? Not too hard to work out.....
Anyway, that's kind of by the by. As Skim says it's the set-up leading up to the doji/in-decision/volume pattern that's important rather than the doji itself.
Skim's example is a far better illustration in that respect. Again the point is.... prior to the BO of that hook at 1119.75 you have a fair idea that there will be stops above it. You know that depending on how many there are, it may cascade, and force people in at market. So, you want to get in before it breaks out, in anticipation of the breakout. Ideally, you would be trading multiple lots and when it breaks out you would get rid of some. Even with a single lot it's a trade that you would most likely be able to scratch if it didn't break out.
In the case of the first example, it's a lot messier. Why? Because there isn't a nice hook or break-out point far enough away from the low of the doji to take out. To me, that's why the bars down from that earlier doji overlap.
My thoughts at the time, were that the place I wanted to lighten up, i.e. the place where retail would be getting in, would be if the low of the doji was taken out. With this as number 1 target, entry had to be somewhere around the close of the doji. As I said in the previous post, that was OK because of the earlier congestion between 1123 and 1121.5 (which is what I always traded off anyway).
As I explained, that tip from Skim works for me because it provides a more or less immediate confirmation of the validity of one of the set-ups I use. More importantly, in the relatively short time I've been using it, after watching it for a good while, it gives early warning if somethings not quite right and allows me to get out with substantially less pain.
Bit long winded...😉 But you did ask...........
F
ford
Excellent posts, Skimbleshanks and sandpiper. I'd love to be able to come back and reply with something substantial but both posts have answered everything I asked for and then some. :cheesy:
What other gems and tricks do you have up your sleeves? 😉
Also, sandpiper I did download an atomic clock syncroniser a while back, which made my IB feed almost identical to qcharts, but I guess sometimes it's slightly out of sync slightly due to the 0.7ms snapshot. Cant win'em all!
thanks again
What other gems and tricks do you have up your sleeves? 😉
Also, sandpiper I did download an atomic clock syncroniser a while back, which made my IB feed almost identical to qcharts, but I guess sometimes it's slightly out of sync slightly due to the 0.7ms snapshot. Cant win'em all!
thanks again