I didn't know you were talking about forex. But the principles of support and resistance apply nevertheless. They're just not as predictable as they would be in another instrument
Be that as it may, the lines you have aren't going to do you any good. Support is found where buyers support price. Resistance is found where they no longer support price or where there is so much selling pressure that buyers can't withstand it.
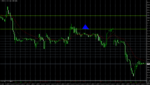
You start with a range, and the range within itself provides its own support and resistance. Price then drops out of the range and buyers step up to support the price. They send it all the way up to the second circle and are then turned back or lose interest (without volume it's impossible to tell). In any case, when price drops back to that same level at which buyers supported it the last time, they again support price. That's what support is all about. Ditto when buyers encounter resistance again at the same level.
The problem for the beginner here is that once beginners figure out what's going on, the professionals pull the plug and end it, returning to ranging, after which price finds R at one of your lines, though this is coincidental as the market has no idea where your lines are located. Your moving averages are of no help whatsoever as they don't provide support or resistance.
This may present a different way of seeing, but it's the way an auction market works. If you want to come up a winner with regard to support and resistance, you'll have to pay closer attention to price and how and where it's moving and less on S/R lines. You will also benefit by including a view of a larger timeframe and larger interval as it is in the larger timeframes that those who have the money to move price operate. If you don't now what they're doing, you will more likely be surprised by what price does and where and how and when.
Db