Hi, I just wanted to say thanks for all the great info on T2W. I'm about as new as you can get and it's been a real education reading some of the threads here.
However, lately I've been finding myself reading one thread then getting sidetracked by another and before you know it 3 hours have past and I haven't actually done any of the things I wanted to. I'm getting to the stage where I want to actually spend more of my time practicing (on a demo account) but I've run into a few problems:
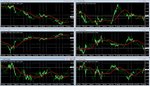
The strategies I've been thinking about all require a trend and I'm having a hard time finding ones on the daily time frame. For instance are any of these attached forex pairs trending at the moment? There seem to be different definitions, the one which I learned is that a trend is when the 50 SMA is simply angling up or down, but it seems to me like the 50 SMA is simply telling you what price was doing before what it's doing now and that price itself may be hitting resistance at the moment. Is there a site or thread that helps newbies out as to what is currently trending?
Also I have a few other newbie questions and was wondering if there is a thread I could ask them in without being mercilessly ridiculed! Googling sometimes works but often the information is partial or overwhelming or takes me 30-60mins to find.
Cheers.
However, lately I've been finding myself reading one thread then getting sidetracked by another and before you know it 3 hours have past and I haven't actually done any of the things I wanted to. I'm getting to the stage where I want to actually spend more of my time practicing (on a demo account) but I've run into a few problems:
The strategies I've been thinking about all require a trend and I'm having a hard time finding ones on the daily time frame. For instance are any of these attached forex pairs trending at the moment? There seem to be different definitions, the one which I learned is that a trend is when the 50 SMA is simply angling up or down, but it seems to me like the 50 SMA is simply telling you what price was doing before what it's doing now and that price itself may be hitting resistance at the moment. Is there a site or thread that helps newbies out as to what is currently trending?
Also I have a few other newbie questions and was wondering if there is a thread I could ask them in without being mercilessly ridiculed! Googling sometimes works but often the information is partial or overwhelming or takes me 30-60mins to find.
Cheers.