Program Trading: Trade Entry

lwebb

Member
Messages
64
Likes
4
Starting point is pedro01's post:

OK - let me suggest ESL # 1.

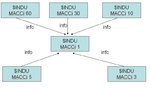
First ESL we need is one that goes on the 60,30,10,5,3,1 minute $INDU

Inputs :
OSArea(-80), OBArea(80); // because different oscillators will have different OS/OB zones

Pseudo Code :

1 - calculate indicator value // here's where you call your macci or its replacement
2 - analyse the value
-- Here's the tricky part - what info do we need about the value
a) is it in the OB or OS zone
b) is it changing direction
c) is it changind direction out of OB/OS
d) is it flat
e) is it pointing up or down
3) based on a to e, we set a global var telling us what that timeframe is doing

So - what do we want to know about the oscillator - just OB & OS - or do we want to make it more sophisticated ?

Let's not get into code yet - let's just lay down the requirements - what is it we want to know about the oscillator in the various time frames ? Remember - it may be more important that it's turning than that it's in OS/OB.

Thoughts ?
 
The above requirements can be captured as a function call per time frame.

The next question is how the results from 60, 30, 10, 5, 3 and 1 minute time frames are used together to decide on trade entry.

How many time frames, and possibly in what order, need to be overbought/oversold ?
How many time frames just need to be heading in the same direction ?

For example: is it sufficient for the 10 minute to be overbought/oversold and lower time frames to be heading the same way? Or should at least 2 timeframes, say 10 and 5 be overbought/oversold with the others heading the same way.

There are likely manual settings such as daily bais, volatility factors (like Friday), etc.

Comments welcome.
 
Last edited:
The above requirements can be captured as a function call per time frame.

The next question is how the results from 60, 30, 10, 5, 3 and 1 minute time frames are used together to decide on trade entry.

How many time frames, and possibly in what order, need to be overbought/oversold ?
How many time frames just need to be heading in the same direction ?

For example: is it sufficient for the 10 minute to be overbought/oversold and lower time frames to be heading the same way? Or should at least 2 timeframes, say 10 and 5 be overbought/oversold with the others heading the same way.

There are likely manual settings such as daily bais, volatility factors (like Friday), etc.

Comments welcome.

OK - higher time frames provide direction:

60 min pointing up - long bias
60 min pointing down - short bias
60 min in OB - short bias but requiring more solid confirmation
60 min in OS - long bias but requiring more solid confirmation
60 min flat - no bias
60 min in OB and pointing up - no bias or long scalp only
60 min in OS and pointing down - no bias or short scalp only
60 min in OB & pointing down - strong short bias
60 min in OS & pointing up - strong long bias

We can weight these accordingly. Direction is easy - when it's in OB/OS - other factors come into play.

On the 60 min, we return a single value depending on the above - we do something similar on 30 min.

Then we can look at values for 60 min & 30 min & make a call. For instance if 60 is OB but 30 is OB but pointing down - more long bias.

This suggests a voting system. Each timeframe can be scored depending on whether it's overbought/oversold or simply heading up/down. The total score of all timeframes can be used for entry decisions.

A noddy example for illustration.

Positive numbers suggest a buy, negative numbers suggest a sell.

If overbought, heading down, score -5.
If overbought, heading up, score -3.
If not overbought but heading down, score -1.
Reverse the signs for oversold.

Example 1:
Using 60, 30 and 10 minute timeframes.
60 is OB, heading down, score -5.
30 is OB, heading down, score -5.
10 is heading down, score -1.
Total = -11

Example 2:
Using 60, 30 and 10 minute timeframes.
60 is OB, heading up, score -3.
30 is OB, heading down, score -5.
10 is heading down, score -1.
Total = -9

Example 1 is a better short as it has more negative weight.
Example 2 is a weaker short (possible scalp) as it has less negative weight.

Variations: Higher time frames should carry more weight. Simple direction may be scored differently depending on whether the oscillator value is above/below zero. Etc.

This is exactly the approach I was thinking of over the weekend. It's relatively easy to code, but it would no doubt need plenty of tweaking. For example, we probably need to distinguish between directional signals and entry signals. We probably would have to score combinations as well e.g. does 60 and 10 being agreement have the same weight as 30 and 10. I think these kinds of considerations would only come out during strategy testing, so we would build the weighting factors in as variable inputs initially in order to compared results

Charlton
 
I thought about weightings too - I am not sure it's the best way forward though. I think the weightings are fairly arbitrary. I am not sure you will need them as the 1 min will have all the info to make a trade so setting the weightings themselves seem like an unecessary intermediate step.

I think is should work something like this:

attachment.php


This is just a suggestion.

Basically, we will have $INDU & MACCi (or other cycle indicator) on each timeframe. Each timeframe will pass something to the 1 min $INDU which is where we will make the decision. I don't like the idea of passing a weighting to the 1 min. I prefer to pass what the status is - so that we can be very flexible in what the 1 min does.

e.g. we could pass 1 piece of "info" (a variable) that contains

OB+ - MACCi is OB and pointing up
OB- - MACCi is OB and pointing down
OBF - MACCi is OB and flat
MIDTURN+ - MACCi is between OB & OS and turning up
MIDTURN- - MACCi is between OB & OS and turning down
OSF
OS-
OS+


etc.

Each of the MACCi timeframes would simply pass this value to the 1 minute and the 1 minute would make a call based on this. This makes the coding easier to write & maintain too.

We could also pass the actual MACCi reading too - but I don't think you'd need it.

We could actually code these ESLs now without worrying too much about the rules - we can code the rules into the 1 min ESL which will have to be different from the others.

Mind you - how do we code 'pointing up' & 'pointing down' ? :smart:

Any ideas - this MACCi > last MACCi enough ??? :eek:nline2lo
 

Attachments

  • overview.JPG
    overview.JPG
    34.3 KB · Views: 207
Last edited:
  • Like
Reactions: BSD
I thought about weightings too - I am not sure it's the best way forward though. I think the weightings are fairly arbitrary. I am not sure you will need them as the 1 min will have all the info to make a trade so setting the weightings themselves seem like an unecessary intermediate step.

I think is should work something like this:

attachment.php


This is just a suggestion.

Basically, we will have $INDU & MACCi (or other cycle indicator) on each timeframe. Each timeframe will pass something to the 1 min $INDU which is where we will make the decision. I don't like the idea of passing a weighting to the 1 min. I prefer to pass what the status is - so that we can be very flexible in what the 1 min does.

e.g. we could pass 1 piece of "info" (a variable) that contains

OB+ - MACCi is OB and pointing up
OB- - MACCi is OB and pointing down
OBF - MACCi is OB and flat
MIDTURN+ - MACCi is between OB & OS and turning up
MIDTURN- - MACCi is between OB & OS and turning down
OSF
OS-
OS+


etc.

Each of the MACCi timeframes would simply pass this value to the 1 minute and the 1 minute would make a call based on this. This makes the coding easier to write & maintain too.

We could also pass the actual MACCi reading too - but I don't think you'd need it.

We could actually code these ESLs now without worrying too much about the rules - we can code the rules into the 1 min ESL which will have to be different from the others.

Mind you - how do we code 'pointing up' & 'pointing down' ? :smart:

Any ideas - this MACCi > last MACCi enough ??? :eek:nline2lo
This sounds good because it uses the conditions rather than totallying weightings, which (if simply totalled) could give false indications. It would be necessary to define all possible combinations of these status codes on each timescale to generate a decision.

With regard to midturn and turning up/down, we might wish to look both at closed bars and bars being formed.

Pointing up and down is almost like the classic question asked on another thread (by someone trying to build an automated strategy also) - what is a trend. In its most simple form I would agree that pointing up and down would be current MACCI - previous MACCI. Variations on this could include waiting for an extra confirmation bar, but that would result in an extra delay on the higher TFs.

The further variation (for higher TFs, but only for pointing up/down) might be to evaluate the bar during its creation e.g. for a 30 min bar save its value at, say, 5 min intervals during its creation and depending on the cumulative diff in value decide if it is currently pointing up/down. This would give an earlier signal, but risks the fact that the bar direction may change by the time it closes.

Charlton
 
I'm for working with closed bars only - but again that could be an option.

If the 60 turns down after 5 minutes - you are looking at a combination of the 60 & the 5 in a way. That may be a bit dangerous. But anyway - let's write some code....

I'll get some coffee - it's 4am here, I need some caffeine before my morning run, then maybe we can do some coding :)
 
I don't know whether this will help but coding the pointing up and down of the oscillator could be made easier with some of the more advanced oscillators.

E.g. the Fisher RVI derives its buy and sell signals when the RVI crosses the trigger above +2 or below -2. So rather than having to use elaborate coding we could just use the trigger above +2 or below -2 as an indication that our oscillator is turning.

Buy Entry:

When 1, 3, 5, 10, 30, 60min < -2

AND 1, 3, 5, 10min RVI Lines cross Trigger Lines

Reverse for sell entry.

Also I was thinking that we could develop the "MIDTURN" theme slightly further by breaking down the range between OB/OS into quartiles. We could have a lower quartile (LQ) and upper quartile (UQ) threshold if we want to be a bit more liberal with our higher TF’s. With this we can also ensure that there is some meat in the move especially if we are looking at the 10min TF for a scalp. So using the Fisher RVI example, the UQ would be +1 and the lower quartile LQ -1.

E.g. Buy signal for scalping strategy:

If 1, 3, 5min < -2 AND 10min <= -1 AND 30, 60min = Last Trigger Buy

AND 1, 3, 5, 10min RVI Lines cross Trigger Lines

Reverse for sell signal

Naeem
 
OK - here's how I see it being coded.

First the 60 min...

Code:
// This indicator will return a value based on analyzing the 60 minute $INDU (or other index)
Inputs : OBThreshold(80), OSThreshold(-80),CycleLength(6), Smoothing(5);
Arrays : CycleHistory[20](0);
Vars : LoopCount(0);

// re-arrange the array so that we store the last 20 values of the indicator in case we get more sophisticated 
// in figuring direction

For LoopCount = 2 to 20 Begin
	CycleHistory[LoopCount -1] = CycleHistory[LoopCount];
End;

CycleHistory[20] = TTCycle(CycleLength,Smoothing);

// Now that we have cycle history - we should call another function (TTDirection) that should tell us which way
// The indicator is going - we'll pass in the array & that function will tell us up, down, flat, etc
// That function can be improved over time

// insert code here...

// Now that we have direction, we can look to see if we are OB, OS (based on inputs above) as well as direction 
// and set 2 global variables for the 60 macci as follows :
// Var 1 - Indicates where it is
// OB - In the Overbrought zone
// OS - In the Oversold zone
// MID - Between OB & OS
// Var 2 - Indicates direction
// UP - moving up
// DOWN - moving down
// FLAT - flat (should not indicate that it is perfecly flat but within a tolerance - say less than 10% angle)

As you can see - it calls TTCycle - this is just a function that contains the cycle analysis method of our choice. At the moment it contains MACCi. This should be our general approach - use functions as much as possible so that we can tweak the functions to change the system. If you put the indicator directly in all of your ESLs, you'll be toast.

Code:
// This Function is a generic placeholder for putting your call to a cycle analysis technique of your choice
// This is currently using MACCi but that can be changed below, not in the calling indicators 
// P Davies 29-October-2008
// 

Inputs : CycleLength(Numeric), Smoothing(Numeric);

TTCycle = Average(CCI(CycleLength), Smoothing);

So - we need a function that takes the array of the last 20 values & gives us direction.

All Indicators I write will start #TT - that keeps them all at the start of the indicator list in TS & all together. Similarly, all Functions will start TT - for the same reason (but you can't use # in function name).

Is this going in the right direction ?

We could actually have a single ESL for 60,30,10,5 & 3 and have it set different global vars depending on the timeframe being used. So maybe we only need 1 ESL for passing signals & 1 for analyzing them at 1 min.

Maybe we also need to have 'TURN' as well as up, down & flat.

Thoughts ?

Feel free to modify the attached ESL and post it back.
 

Attachments

  • TT_60_CYCLE.ELD
    4.9 KB · Views: 25
Last edited:
I don't know whether this will help but coding the pointing up and down of the oscillator could be made easier with some of the more advanced oscillators.

E.g. the Fisher RVI derives its buy and sell signals when the RVI crosses the trigger above +2 or below -2. So rather than having to use elaborate coding we could just use the trigger above +2 or below -2 as an indication that our oscillator is turning.

Buy Entry:

When 1, 3, 5, 10, 30, 60min < -2

AND 1, 3, 5, 10min RVI Lines cross Trigger Lines

Reverse for sell entry.

Also I was thinking that we could develop the "MIDTURN" theme slightly further by breaking down the range between OB/OS into quartiles. We could have a lower quartile (LQ) and upper quartile (UQ) threshold if we want to be a bit more liberal with our higher TF’s. With this we can also ensure that there is some meat in the move especially if we are looking at the 10min TF for a scalp. So using the Fisher RVI example, the UQ would be +1 and the lower quartile LQ -1.

E.g. Buy signal for scalping strategy:

If 1, 3, 5min < -2 AND 10min <= -1 AND 30, 60min = Last Trigger Buy

AND 1, 3, 5, 10min RVI Lines cross Trigger Lines

Reverse for sell signal

Naeem


Excellent points.

Do you think you should watch Fischer in real time before we commit to using it.

We know MACCi works but isn't the best - so we need to get some experience with Fischer (or whatever) before replacing MACCi with it.

No point in jumping in to something unless we are 100% sure it outperforms MACCi in real life as opposed to on paper.

The MESA software site that was mentioned in the last seminar has a number of indicators (https://mesasoftware.com/indicators.htm)

THE WORLD'S BEST INDICATORS

There are two basic types of technical indicators for market trading - trend followers and oscillators. We have developed and/or collected the worlds best indicators in these two categories as TradeStation Plugins. The indicators in this collection are not adaptive to the measured market cycle.

ANTAEAN OSCILLATORS

This collection of oscillators are those that either mark the market turning points with surgical precision or have exceptionally low lag. With these oscillators there is no longer a need to wait for confirming signals. The oscillators come as ELS code for plug-in to your TradeStation. Each oscillator is described in an accompanying information file. The EasyLanguage code is open and not protected. The oscillators in this collection are:
Sinewave
Cyber Cycle
Stochastic RSI
Fisher Transform
Inverse Fisher Transform
CG Oscillator


HERCULEAN SMOOTHERS
The indicators in this collection are adaptive to market volatility or are nonlinear filters used to smooth the data. If your trading encounters whipsaw trades, these nonlinear filters may be your answer. These filters move rapidly when the market moves rapidly, but remain steady and smooth in sideways markets. The filters come as ELS code for plug-in to your TradeStation. Each filter is described in an accompanying information file. The EasyLanguage code is open and not protected. The smoothers in this collection are:
KAMA (Kaufman Adaptive Moving Average)
VIDYA (Variable Index Dynamic Average)
MAMA (MESA Adaptive Moving Average)
EHLERS Filter
Median Filter
MA-Median Difference Tuned Moving Average
Nonlinear Laguerre

So - if this is the cream of the crop, perhaps we need to drop the $195 to buy them all so we can test them out.
 
Excellent points.

Do you think you should watch Fischer in real time before we commit to using it.

We know MACCi works but isn't the best - so we need to get some experience with Fischer (or whatever) before replacing MACCi with it.

No point in jumping in to something unless we are 100% sure it outperforms MACCi in real life as opposed to on paper.

The MESA software site that was mentioned in the last seminar has a number of indicators (https://mesasoftware.com/indicators.htm)

So - if this is the cream of the crop, perhaps we need to drop the $195 to buy them all so we can test them out.

Pete,

It's the ANTAEAN OSCILLATORS that we should be looking at. We don't have to pay anything because I’ve already posted the codes for some oscillators that are more advanced than the ones up for sale at MESA. I’ve also given brief explanations on how they are used:

http://www.trade2win.com/boards/tec...rogrammed-trade-development-3.html#post546336

http://www.trade2win.com/boards/tec...rogrammed-trade-development-5.html#post547520


Here all the indicators posted by lwebb:

http://www.trade2win.com/boards/tec...rogrammed-trade-development-5.html#post547498

I’ve been looking at the Fisher RVI on all TF’s. It’s very difficult to track but there are signs that it could be very useful. I suggest we code up two indicators with our buy and sell conditions so that we can both back test and forward test them.

We can get two groups using two different indicators to test over say a 2 - 4 week period. One group can test the Fisher RVI and another group could test the Inverse Fisher Cyber Cycle. The reason I propose these 2 oscillators is because the buy and sell signals are generated in a similar way to the Macci. i.e All three oscillators (Fisher RVI, Inverse Fisher and Macci) require a certain threshold to be reached before we can say OB/OS. Most of the other advanced oscillators are not designed to make use of OB/OS conditions to generate buy and sell signals.

The Inverse Fisher Cyber Cycle does use OB/OS conditions through a +1 and -1 range. Ehlers doesn’t use terms like OB or OS for the Fisher RVI, he states that the +2 and -2 thresholds should be used to prevent signal whipsaws. I think that may be just another way of saying OB/OS lol

What do you guys think?

Naeem
 
Naeem

OK - so you have some of the MESA indicators... That's cool.

I count 7 Herculean Indicators on the MESA site - you have a subset of that. By what method are we going to evaluate which of the indicators is best ?

No offence - but you seem to have made up your mind about which one to use.

I think we need a method of qualification - performance relative to MACCi for instance for each of the indicators we have. We should also be looking to find the code for the other Herculean indicators so that we can evaluate them.

As for different sets of code for different indicators - it's just a simple change, we can plug in anything. What I think we need though is to not have a preference for any indicator but to qualify which is best through a formal analysis process.

Cheers

Pete

From what I understand the Herculean indicators are trend based indicators. We require cycle based indicators (Antaean) for our entry signals if we want to stay consist with Iraj's method.

As I explained before I only propose the Inverse Fisher Cyber Cycle and Fisher RVI because they require certain thresholds to be met before a buy and sell signal can be generated. Similar to the way we observe OB/OS conditions with the Macci. It makes it easier to test because from what I've read the other Ehler oscillators do not have an OB/OS function, more emphasis is placed on the Trigger Lines.

I propose we start test something we are familiar with first before we start testing oscillators that work very differently from Macci. We all know this a deductive process so I’m not suggesting we stick with these and forget the rest, we have to start somewhere.

What do you think we should start testing first?

Naeem
 
We need to get a framework in place and for this purpose starting with MACCI should be sufficient. The design will allow for easy pluggability so introducing other oscillators won't be an issue. Also once an initial system is going it's easy to objectively compare oscillators.
 
e.g. we could pass 1 piece of "info" (a variable) that contains

OB+ - MACCi is OB and pointing up
OB- - MACCi is OB and pointing down
OBF - MACCi is OB and flat
MIDTURN+ - MACCi is between OB & OS and turning up
MIDTURN- - MACCi is between OB & OS and turning down
OSF
OS-
OS+


etc.

In terms of information each timeframe needs to capture, some suggestions:

Direction: Up, Down.

Zone: OB, OS, Middle (though this may be broken down into further bands)

Turn: Oscillator has turned; it may also be useful to know how many bars ago the turn happened.

Oscillator value: may be useful in future.
 
I thought about weightings too - I am not sure it's the best way forward though. I think the weightings are fairly arbitrary. I am not sure you will need them as the 1 min will have all the info to make a trade so setting the weightings themselves seem like an unecessary intermediate step.

[ diagram ]

This is just a suggestion.

Basically, we will have $INDU & MACCi (or other cycle indicator) on each timeframe. Each timeframe will pass something to the 1 min $INDU which is where we will make the decision. I don't like the idea of passing a weighting to the 1 min. I prefer to pass what the status is - so that we can be very flexible in what the 1 min does.

I like the idea of each timeframe publishing data, providing for a better picture of what's going on.

All the timeframes should be indentical in this respect though. An Entry component should be the point where this information is processed and an entry decision reached. Burdening a timeframe with this couples/complicates code.
 
I found time to make a few changes.

New ESL

Code:
// This indicator will return a value based on analyzing the 60 minute $INDU (or other index)
//

Inputs : OBThreshold(80), OSThreshold(-80),CycleLength(6), Smoothing(5);

Arrays : CycleHistory[20](0);

Vars : LoopCount(0), Zone(99), Direction(99), RTNVal(0);

// re-arrange the array so that we store the last 30 values of the indicator in case we get more sophisticated 
// in figuring direction

For LoopCount = 2 to 20 Begin
	CycleHistory[LoopCount -1] = CycleHistory[LoopCount];
End;

CycleHistory[20] = TTCycle(CycleLength,Smoothing);

// Now that we have cycle history - we should call another function (TTDirection) that should tell us which way
// The indicator is going - we'll pass in the array & that function will tell us up, down, flat, etc
// That function can be improved over time

// Direction - Indicates direction
//  1 moving up
// -1 moving down
//  0 flat (should not indicate that it is perfecly flat but within a tolerance - say less than 10% angle)

// Insert Function Call to set direction here !!
// What follows is not final - just a simplification

If CycleHistory[20] > CycleHistory[19] then
	Direction = 1
	else if CycleHistory[20] < CycleHistory[19] then
		Direction = -1
else
	Direction = 0;

// Now that we have direction, we can look to see if we are OB, OS (based on inputs above) as well as direction 
// and set 2 global variables for the 60 macci as follows :
// Zone - Indicates where it is
//  1 In the Overbrought zone
// -1 In the Oversold zone
//  0 Between OB & OS

If CycleHistory[20] >= OBThreshold then
	Zone = 1   						// Overbrought
	else if CycleHistory[20] <= OSThreshold then
		Zone = -1 				    // Oversold
else
	Zone = 0; 						// Between overbrought & oversold


// Now - set the global variables depending on the interval
// I haven't used global variables before but it appears you can only do numerics ! 
// Bugger - out go my OB, OS, MID setting ideas...

Switch(BarInterval) 
Begin
  Case 60:
    RTNVal = GVSetNamedFloat("Zone60", Zone);
    RTNVal = GVSetNamedFloat("Direction60", Direction);
  Case 30:
  	RTNVal = GVSetNamedFloat("Zone30", Zone);
    RTNVal = GVSetNamedFloat("Direction30", Direction);
  Case 10:
    RTNVal = GVSetNamedFloat("Zone10", Zone);
    RTNVal = GVSetNamedFloat("Direction10", Direction);
  Case 5:
  	RTNVal = GVSetNamedFloat("Zone5", Zone);
    RTNVal = GVSetNamedFloat("Direction5", Direction);
  Case 3:
    RTNVal = GVSetNamedFloat("Zone3", Zone);
    RTNVal = GVSetNamedFloat("Direction3", Direction);
  Case 1:
  	RTNVal = GVSetNamedFloat("Zone1", Zone);
    RTNVal = GVSetNamedFloat("Direction1", Direction);
End;

Note - you can only send numbers as global vars apparently.

This ESL is a single one for all time zones, we then need another ESL to take these global vars & manage the entries.

I have not yet tested this and need to work more on the direction part.
 

Attachments

  • TT_MTL_CYCLE.ELD
    7.5 KB · Views: 25
Note - you can only send numbers as global vars apparently.

This is not the case. If you read the word doc in the zipped file in the global variable thread

https://www.tradestation.com/Discus...earchTerm=text global variable&txtExactMatch=

It states it will handle Strings (text strings of up to 250 characters each). As an example if you created a test indicator containing the following:

variables:
MyBigString( "" ) ;

MyBigString = "Four score and seven years ago our fathers brought forth on this " + "continent, a new nation, conceived in Liberty, and dedicated to the " + "proposition that all men are created equal." ;

Value1 = GVSetString( 3, MyBigString ) ;

Print( GVGetString( 3 ) ) ;


and a second test indicator containing just the final print statement. Open the message log. Put the first indicator into one chart window yo will see the text appear there. Clear the message log and open another chart window placing the indicator with just the print command in it and verify. YOu should see the same text printed again.

It's capable of passing 10,000 strings each 250 characters long !!!

Charlton
 
Thanks Charlton ! I can now use more intuitive values for the global variables.

OK - so now we have an indicator #TT_MTL_CYCLE. This indicator should be put on the 60/30/10/5/6/1 and should be a replacement of your current MACCi indicator as it will plot the cycle on the chart as well as set the global variables.

Code:
// This indicator will return a value based on analyzing the 60 minute $INDU (or other index)
//

Inputs : OBThreshold(100), OSThreshold(-100),CycleLength(6), Smoothing(5), AlertLevelOB(80), AlertLevelOS(-80);

Arrays : CycleHistory[20](0);

Vars : LoopCount(0), Zone(""), Direction(""), RTNVal(0);

// re-arrange the array so that we store the last 30 values of the indicator in case we get more sophisticated 
// in figuring direction

For LoopCount = 2 to 20 Begin
	CycleHistory[LoopCount -1] = CycleHistory[LoopCount];
End;

CycleHistory[20] = TTCycle(CycleLength,Smoothing);

// Now that we have cycle history - we should call another function (TTDirection) that should tell us which way
// The indicator is going - we'll pass in the array & that function will tell us up, down, flat, etc
// That function can be improved over time

// Direction - Indicates direction
//  + moving up
//  - moving down
//  F flat (should not indicate that it is perfecly flat but within a tolerance - say less than 10% angle)

// Insert Function Call to set direction here !!
// What follows is not final - just a simplification

If CycleHistory[20] > CycleHistory[19] then
	Direction = "+"
	else if CycleHistory[20] < CycleHistory[19] then
		Direction = "-"
else
	Direction = "F";

// Now that we have direction, we can look to see if we are OB, OS (based on inputs above) as well as direction 
// and set 2 global variables for the 60 macci as follows :
// Zone - Indicates where it is
// OB In the Overbrought zone
// OS In the Oversold zone
// MID Between OB & OS

If CycleHistory[20] >= OBThreshold then
	Zone = "OB"   						// Overbrought
	else if CycleHistory[20] <= OSThreshold then
		Zone = "OS"				    // Oversold
else
	Zone = "MID"; 						// Between overbrought & oversold


// Now - set the global variables depending on the interval
// I haven't used global variables before but it appears you can only do numerics ! 
// Bugger - out go my OB, OS, MID setting ideas...

Switch(BarInterval) 
Begin
  Case 60:
    RTNVal = GVSetNamedString("Zone60", Zone);
    RTNVal = GVSetNamedString("Direction60", Direction);
  Case 30:
  	RTNVal = GVSetNamedString("Zone30", Zone);
    RTNVal = GVSetNamedString("Direction30", Direction);
  Case 10:
    RTNVal = GVSetNamedString("Zone10", Zone);
    RTNVal = GVSetNamedString("Direction10", Direction);
  Case 5:
  	RTNVal = GVSetNamedString("Zone5", Zone);
    RTNVal = GVSetNamedString("Direction5", Direction);
  Case 3:
    RTNVal = GVSetNamedString("Zone3", Zone);
    RTNVal = GVSetNamedString("Direction3", Direction);
  Case 1:
  	RTNVal = GVSetNamedString("Zone1", Zone);
    RTNVal = GVSetNamedString("Direction1", Direction);
End;

Plot1(CycleHistory[20], "Cycle"); 
Plot2(OBThreshold,"OverBought"); 
Plot3(OSThreshold,"Oversold"); 
plot4(0,"Zero");
Plot5(AlertLevelOB,"Alert");
Plot6(AlertLevelOS,"Alert");

Then the next one goes on the 1 minute chart. It's a show me. It's called #TT_ENTRYPOINT.

It will get the global variables & plot entry points.

Code:
vars : Zone60(""),Zone30(""), Zone10(""), Zone5(""), Zone3(""), Zone1(""), Direction60(""), Direction30(""),
	Direction10(""), Direction5(""), Direction3(""), Direction1(""), Bias(" "), Trigger(" ");
// Reset the trigger every bar

Trigger = " ";

// Get the global variables
	
Zone60 		= GVGetNamedString("Zone60"," ");
Direction60 = GVGetNamedString("Direction60"," ");
Zone30 		= GVGetNamedString("Zone30"," ");
Direction30 = GVGetNamedString("Direction30"," ");
Zone10 		= GVGetNamedString("Zone10"," ");
Direction10 = GVGetNamedString("Direction10"," ");
Zone5 		= GVGetNamedString("Zone5"," ");
Direction5 	= GVGetNamedString("Direction5"," ");
Zone3 		= GVGetNamedString("Zone3"," ");
Direction3 	= GVGetNamedString("Direction3"," ");
Zone1 		= GVGetNamedString("Zone1"," ");
Direction1 	= GVGetNamedString("Direction1"," ");

// if higher timeframes(60,30,10) are OB or pointing down - short bias
// if higher timeframes(60,30,10) are OS or pointing up - long bias

if (Zone60 = "OB" or Direction60 = "-") 
	and (Zone30 = "OB" or Direction30 = "-") 
	and (Zone10 = "OB" or Direction10 = "-") then
		Bias = "Short"
	else if (Zone60 = "OS" or Direction60 = "+") 
		and (Zone30 = "OS" or Direction30 = "+") 
		and (Zone10 = "OS" or Direction10 = "+") then
		Bias = "Long" else
			Bias = "None";

// Look for entry points on lower timeframes
// OS/OB in either 5/3 + 1 is OK

if bias = "Short" and (Zone5 = "OB" or Zone3 = "OB") and Zone1 = "OB" then
		Trigger = "SellShort";

if bias = "Long" and (Zone5 = "OS" or Zone3 = "OS") and Zone1 = "OS" then
		Trigger = "Buy";

if Trigger = "SellShort" then begin
	Plot1(Low);
	Alert;
end;

if Trigger = "Buy" then begin
	Plot2(High);
	Alert ;
end ;

Issues

1 - I am not sure if the strategy itself is correct - I think it may be too strict. I hope you guys can follow the code and make suggestions. I hope the comments in the code help the non-coders.

2 - I haven't had time to test it as I'm in LA on business & it's really hectic at the moment it does compile & it does paint the cycle correctly (at the moment the cycle it paints is MACCi).

3 - We can do a much better job of direction than just comparing the past 2 values but I just haven't had the time to look into this.

This is the baseline for entry point code - we all need to get involved now to tweak the entry rules. For instance, am I expecting too much for the 5/3 and 1 to be over 100 or under 100 ?

Both ESLs and the function are in the attached .ELD
 

Attachments

  • TT_CYCLE.ELD
    12.5 KB · Views: 20
Top