Grey1
Senior member
- Messages
- 2,190
- Likes
- 210
Consolidation ..
Consolidation happens when two cycles in two adjacent time frames are out of phase or direction .. For example the 1 minute cycle signals Over sold and the 3 minutes is over bought .. As soon as they both get say over bought or over sold we be having a break out…..The size of the break out depends on the time frames confirming each other for example if 15 tick and 30 tick confirm then the break out will be tiny equally when the 1 hour and 30 minute confirm then you get a break out.. Mypoint is that market continuously is going through break out but we only notice those that are profitable to us > SO what do we see after a break out? The answer is a TREND…. How ever if you stand back and watch the bigger picture we don’t see a trend.. We see consolidation again ..
So what am I trying to say here.?. My point is instead of following trend following indicators then one might be better off to study the OB/OS oscillators…use any kind of OB/OS indicator you wish …
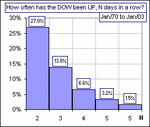
A simple example of this strategy is IF stockX has been having a good run last past 3 days then THERE IS MORE CHANCE OF A REVERSAL… So on the forth day just before the market close watch the stock and if it was weak ( you need this confirmation) then there is high probability that stock will open lower next day ..
I have an account with Datek that execute all my swing trades. My portfolio using this basic techniques has been profitable..
Simple but effective.. far simpler than neural forecasting models that has lost me $$$

