Profit everyday with 5ema-13ema-stoch

suresh1_1

Member
Messages
54
Likes
0
Hi All,

I want to introduce a best way of trading in intraday using charts.

I basically follow few indicator.

The indicators are 5ema, 13ema and Stochastic.

Now where can i get all this settings.
This setting is available in any paid charts or you can visit the free real time intraday charts website
http://rtcharts.110mb.com/charts-inter.html

How to use this indicators.

1. When 5ema crosses the 13ema line, that is when 5ema moves from down to up and crosses 13ema, enter long.
2. To confirm the buy, make sure in fast stochastic, the blue line is above red line.

If both the conditions mentioned above are fullfiled, enter long.
3. Now to exit, watch the below two conditions
a. if 5ema moves below 13ema or
b. if blue line moves below red line.

Reverse applies for short.

Free Real time intraday charts of all indices DowJones, Nasdaq, HAngseng, FTSE, CAC, Nifty, DAX, Kospi are available at

see the explanation in image below
27wzsq8.png
 
Last edited:
Hi suresh.I just wanted to tell that this moving averages do not work for intraday.If u take Tradestation and test u will know the real picture.It always looks good with 2020 hindsight.:)
 
the way I see it is that you start out in the hole because you have to cover your commissions and the spread.
so depending on how much those two add up, you have to find a market that trends enough to cover these costs plus make a profit.

Then you also have to find a way to not trade when the marked is chopping back and forth,
so you don't end up losing all the profits you made.

I think it's possible to come up with some months that trend more, like during the month of October this might work more often than not.

Then don't trade it during the summer months, then looks at some of the other months and see if you could squeak out some more times that it would work.
 
Hi All,

I want to introduce a best way of trading in intraday using charts.

I basically follow few indicator.

The indicators are 5ema, 13ema and Stochastic.

Now where can i get all this settings.
This setting is available in any paid charts or you can visit the free real time intraday charts website
http://rtcharts.110mb.com/charts-inter.html

How to use this indicators.

1. When 5ema crosses the 13ema line, that is when 5ema moves from down to up and crosses 13ema, enter long.
2. To confirm the buy, make sure in fast stochastic, the blue line is above red line.

If both the conditions mentioned above are fullfiled, enter long.
3. Now to exit, watch the below two conditions
a. if 5ema moves below 13ema or
b. if blue line moves below red line.

Reverse applies for short.

Free Real time intraday charts of all indices DowJones, Nasdaq, HAngseng, FTSE, CAC, Nifty, DAX, Kospi are available at

see the explanation in image below
27wzsq8.png

Suresh,
What setting do you use for the fast stochastic?

Regards,

Michael
 
Last edited:
Hmmm - is Suresh one of the 'chosen ones' ?

He seems to be able to spam the board with impunity...
 
people jealous of other being getting educated

Some people here are getting jealous as now normal people are getting educated on charts and normal people is now in reach of daily profit.
 
The method you are presenting is the first thing a person will be looking for, just from what you presented i belive you have alot to discover in this business.

Just simple crossovers might work on days when market is strong and trending, now let me ask you what happens when the market going sideways for 2-3 days. Jupp....you will get killed, and also remember that when the crossover happens, you are buying the top and getting apretty bad entry that also require a big stop.

Your thinking is not dumb, but it simpli just dont work, i suggest you search and learn more about support and resistance and try to use that with some simple moving averages for direction.

Her is a simple list of things that will help you:

1:Learn to use multiple timeframes (for a bette view of the market and where it might head)

2:Read up on support and resistance

3:I suggest you use either tick or volume charts when finding levels of support and resistance, and dont use anything lower then 300tick.

Best of luck to you in your trading, if you have any questions then just ask.

Regards
Bashir N
 
:I suggest you use either tick or volume charts when finding levels of support and resistance, and dont use anything lower then 300tick.

Can you say why you have a preference for this ?


Paul
 
Hi All,

I want to introduce a best way of trading in intraday using charts.

I basically follow few indicator.

The indicators are 5ema, 13ema and Stochastic.

Now where can i get all this settings.
This setting is available in any paid charts or you can visit the free real time intraday charts website
http://rtcharts.110mb.com/charts-inter.html

How to use this indicators.

1. When 5ema crosses the 13ema line, that is when 5ema moves from down to up and crosses 13ema, enter long.
2. To confirm the buy, make sure in fast stochastic, the blue line is above red line.

If both the conditions mentioned above are fullfiled, enter long.
3. Now to exit, watch the below two conditions
a. if 5ema moves below 13ema or
b. if blue line moves below red line.

Reverse applies for short.

Free Real time intraday charts of all indices DowJones, Nasdaq, HAngseng, FTSE, CAC, Nifty, DAX, Kospi are available at

see the explanation in image below
27wzsq8.png

It doesn't work Suresh.
I tried it.
The set-up appears to be no bette than 50%
It's like flipping coins.
 
Why on earth are you guys even replying to this muppet ?

Let's look at the threads he's started.

- Profit everyday with 5ema-13ema-stoch
- Camarilla Trading - Profit Everyday
- Free Real Time Intraday Charts with Technical Analysis
- Pivot Based Trading - Profit Daily - 1:2 risk reward ratio
- Pivot Based Trading - 1:2 risk reward ratio - (Risk less Profit more)

He must be making a lot of profit daily...

Either that or these threads are just ways to hook newbies into his website so he make money off the google adsense revenue (n).
 
Some people here are getting jealous as now normal people are getting educated on charts and normal people is now in reach of daily profit.

You may be making daily profit but most aren't here to make money from google :rolleyes:
 
when a "Ads by Google" pane appears in a web page i was under the impression that the webby didn't get paid for these, i am no expert at google ads, so have asked appropriate questions about sites that contain google ads that are linked to.

when a definitive answer is given, we will look at the type of ads being linked to in this instance and take the appropriate actions, in the meantime i have merged/removed threads and removed links as appropriate, apart from the first post in each thread.

suresh1_1, it would be helpful if you stop posting links in every post, also please don't include link addresses ten feet high in your charts! the links i have left in your first post will suffice, thanks :)

https://www.google.com/adsense

Maximize revenue from your online content

Google AdSense is a free program that enables website publishers of all sizes to display relevant Google ads and earn

You guys are sooooo 2005 at T2W :rolleyes:
 
Got to say though - the "Increase your commodity Trading profits 100% in 10 minutes is tempting".

I'll hold out though - I am fairly sure that it can be done in 3 minutes and combined with a sit on the sofa, all you can eat, guaranteed six-pack in 5 days plan....

Lordy....
 

Attachments

  • ads.jpg
    ads.jpg
    316.9 KB · Views: 417
Can you say why you have a preference for this ?


Paul

Sure Trader333, it will be a pleasure, i think you will find it very usefull as i do.

I have personaly over time changed my trading style to an more support and resistance and priceaction method and with a few as possible indicators.

I look at mostly two charts:

4000tick with an 14sma--> this is my anker chart for picture of the longer term, and i use the 14sma for direction on the bigger timeframe.

I also look at volume on a small 5min chart, to gauge buying and selling pressure.
And i use a slow stoch on a 200tick chart to find low cycles in the market.

500tick chart with 30ema--->short-med term chart that i trade of and use the 30ema for direction.

The thing is that if you use anyting lower then an 300tick chart, you will quickly loose perspective on the entire market feel. Looking at the market at a shorter timeframe then 300tick will make you not see the actual picture, and you will be stick putting more empasis to the shortterm picture, and that will results in losses, as you get into levels that are not relevant.

IF you get your direction right on your 500tick chart, i then use a stochastic on a 200tick chart to catch the low cycle in the market, and those entires gives you most of the time the swing lows, and in most case it gives you around 10-30 ticks with little problems.

I have tryed to change my 500tick into an 300 and 250 tick even, and it only added more confussion in me, as i would loose controll of picture of the market. I might see support at 9300, but actualy support might be at 9250 because my eyes are to narrow on that timeframe and i miss the actualy price level. And with the 10tick ym stop i am using, i cant afford to miss the entrie by even 5-6 ticks. If price goes 5-6 ticks against me , i feel i have gotten the wrong level, i might be close to the actualt level, but 5-6 yticks can be the difference betwen a winning trade and a loosing trade.

If you have look at the 200tick chart, and add a slow stoch, just look at the slow d line, not the slow-k. We only want to look at the slow d and see if its below 20, and u will in most cases seee that if you short on a low cycle, then you will get screwed, and if you buy at a high cycle, then in best case, if the trend is on your side, you might get a few ticks, but in most cases price will will reverse against you. If you would have waited for it to cycle below 20, then you would have caught the low swing.And cashed in a decent 10-30ticks. I am saying this from experience, and what i have self gonne true.

The 200tick with a slow stoch, is a great tool to get at the better levels, but for finding the levels, using anything lower 300tick is just suicide. And i am using 500tick, and that is right on, you can even use a 1000tick, but in that timeframe, you will only bee looking at the low swing entries, and jumping into a trade that is on the move and you want an entry, then a 1000tick is not favorable, but a 500tick is.

I find volume and tick charts to give abou the same information, but i have totatly looked away from timecharts. I find them to be give very little information, and basing your trade on price formation on a tick chart is more reliable then on a timebased chart.

Either way, this is my opinion and im sure many will dissagree with me, i will make a full post of this method and see how people like it. WIll be nice to get a discussion around this.

I just an extra note, i have tryed everything from 35tick chart to an 40000tick chart hehe, and evertime i find the 500tick and the 4000tick to be the most reliable for my method and style. Stressing and trading is not my game, and this new method is really as stressfree as it gets. You find a level ,and then you wait for it to come to you. I never chasse the market..never never. Chassing equals = losses

Anways, this post is getting to long and alot longer then i thought, and i am just blabbering.

I will make a post tomorow about it and post a video as well.

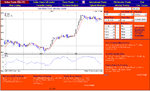
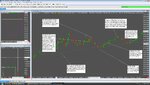
I have attached a few of the trades i took last friday, so you can get better understanding of how i use it:


With kind regards
Bashir Naimy
 

Attachments

  • bn1.jpg
    bn1.jpg
    308 KB · Views: 489
Last edited:
Top