dbphoenix said:
Those who are interested in the interpretation of price movement, the relationship of price and "volume" (i.e., trading activity, not inventory), and how all of this interacts with support and resistance would have a tough time finding a better example than the movement of the major U.S. indices over the past two-three months, particularly yesterday.
The question now is what the probabilities are from this point of an upmove or a downmove. I hope that those who've read this thread have a handle on this by now. If not, analyzing the movements during this period may help to tie up whatever loose threads there may be.
--Db
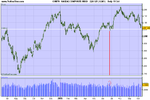
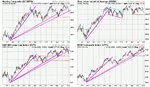
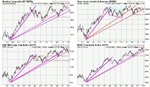
This is my understanding of where we are, using the S&P
1 - Weekly Chart - Momentum is clearly lessening, as evidenced by having to fan the blue trend lines, and also by having to flatten out the red supply lines - meaning that supply is coming into the market at relatively lower & lower levels. Trend is still up, however there is a potential trend change at hand, as the last blue trend line has been broken to the down side.
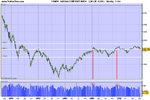
2 - Daily Chart - Again we can see from having to fan the 2 red trend lines that momentum to the upside is lessening.
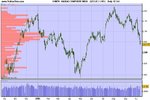
In the A-C area, we have a healthy uptrend, the uptrend is broken in the C-D area however bulls would probably be calling this a normal correction, as volume is relatively low in this area.
Price reverses at D, slightly above the previous swing low, this too would still be bullish as we have a higher low.
Bulls hit there first problem area in the D-E zone where price makes a lower high and this should be the first major warning sign for the bulls. Also worrying should be the very high volume day around the 19 September, which failed to propel price to new highs, looks like a lot of distribution is going on.
Price turns up again in the latter half of September, which forms a nice coil (blue lines). Shortly after E price falls through support in the coil.
The current question is will price hold at current levels, being the level of the swing low formed at end June.
And to me that is also the significance of 2050 in the Nasdaq, it is the bottom of the potential resistance zone & last major swing low prior to the high.
If this level is broken to the downside, the trend would officially have turned down (at least by my definitions....)
All criticisms welcome
😕