Price, (Volume), Support, Resistance, Demand, Supply . . .

dbphoenix said:
Those who are interested in the interpretation of price movement, the relationship of price and "volume" (i.e., trading activity, not inventory), and how all of this interacts with support and resistance would have a tough time finding a better example than the movement of the major U.S. indices over the past two-three months, particularly yesterday.
--Db

Good to see you posting again db - you've been very quiet of late!

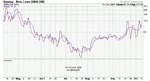
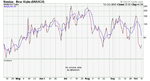
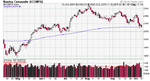
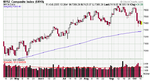
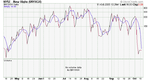
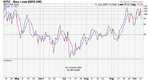
Weekly and Daily chart of the Naz Comp attached.
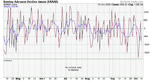
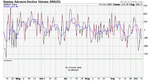
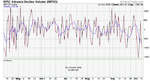
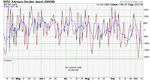
The horizontal green lines denote zones of S/R, the bloo line is the long term trend. The red channel is included as traders the world over will have spotted this and applied convention T.A. criteria and concluded that it's a big juicy bull flag. Conventional wisdom dictates that price will retrace to the long term trend line and then shoot northwards with greater speed and velocity than Aston Martin's new Vantage. However, readers of this thread will have a watchful eye on volume which, broadly speaking, has tended to rise when the index has moved up and dropped off when the index has fallen. Up until this week that is, when the volume accompanying Tues, Weds, and Thurs bear candles was high. To my mind, this brings into question contrakt's assertion that "probabilities favour moves to the upside".
Tim.
 

Attachments

  • Naz_Comp_Daily.PNG
    Naz_Comp_Daily.PNG
    52.2 KB · Views: 325
  • Naz_Comp_Weekly.PNG
    Naz_Comp_Weekly.PNG
    49.2 KB · Views: 313
Last edited:
dbphoenix said:
The question now is what the probabilities are from this point of an upmove or a downmove. I hope that those who've read this thread have a handle on this by now. If not, analyzing the movements during this period may help to tie up whatever loose threads there may be.

--Db

One may see a test of the spring from July 7th on the $SPX, $COMPQ, and the $INDU.

erie
 
timsk said:
Conventional wisdom dictates that price will retrace to the long term trend line and then shoot northwards with greater speed and velocity than Aston Martin's new Vantage. However, readers of this thread will have a watchful eye on volume which, broadly speaking, has tended to rise when the index has moved up and dropped off when the index has fallen. Up until this week that is, when the volume accompanying Tues, Weds, and Thurs bear candles was high. To my mind, this brings into question contrakt's assertion that "probabilities favour moves to the upside".
Tim.

Is all of this consistent with what you read in Trendlines and the Practicum?

--Db
 
contrakt said:
Yesterday exhaustion sell of towards earlier S and even after this big volume day price didn't finish at low of the day.

If you feel like it, elaborating on this might help those who don't have a handle on the dynamics of hammers (or whatever one chooses to call them).

--Db
 
dbphoenix said:
If you feel like it, elaborating on this might help those who don't have a handle on the dynamics of hammers (or whatever one chooses to call them).

--Db

Well, depending on my timeframes and the things I map:

If in the comming days, after this bigg sell-of day, the mayority of the indexes that I watch start making new lows, than S dindt hold. So in that case I must look for opportunities to go short.
Otherwise, I will look for solid oppotunities to take a long position.


take care
 
Last edited:
dbphoenix said:
Is all of this consistent with what you read in Trendlines and the Practicum?
--Db
:LOL:
Db, as you are the author of both documents and I am the student, I assume your question is rhetorical as you already know the answer!
That said, I'm toying with starting a thread on trendlines as I struggle with them and, certainly, the long term blue trendline (on the chart attached to post # 617) isn't drawn where (I think) you - and Sperandeo - would recommend. Is this what you're driving at?
Tim.
 
timsk said:
:LOL:
I'm toying with starting a thread on trendlines as I struggle with them and, certainly, the long term blue trendline isn't drawn where (I think) you - and Sperandeo - would recommend. .
timsk - there is no special way or 'recommended' way to draw a trend line. You don't even need to draw one. You can see it quite plainly. Forget tops-to-tops or bottoms-to-bottoms.

There's nothing fancy, nothing difficult. Just use your eyes and follow the slope. If you can't easily discern one - there isn't one.
 
Yes, and "what if ?" ...have you stopped to consider that too ?...:eek: You might benefit from looking again, more closely this time.....
 
Last edited:
timsk said:
:LOL:
Db, as you are the author of both documents and I am the student, I assume your question is rhetorical as you already know the answer!
That said, I'm toying with starting a thread on trendlines as I struggle with them and, certainly, the long term blue trendline (on the chart attached to post # 617) isn't drawn where (I think) you - and Sperandeo - would recommend. Is this what you're driving at?
Tim.

Not rhetorical at all. Since what you've advanced is the opposite of what I wrote, then I must not have explained it properly. On the other hand, if you're not applying what I wrote to the process you went through to arrive at your conclusions, then that represents a different avenue.

In any case, with regard to your particular question, where anyone "recommends" drawing the TL is largely irrelevant. The job of a TL is to show trend. It's not supposed to provide S/R and it doesn't. One can "believe" that it does, but I suggest examining evidence rather than beliefs.

--Db
 
contrakt said:
Well, depending on my timeframes and the things I map:

If in the comming days, after this bigg sell-of day, the mayority of the indexes that I watch start making new lows, than S dindt hold. So in that case I must look for opportunities to go short.
Otherwise, I will look for solid oppotunities to take a long position.


take care

The following is more in line with what I was referring to regarding the dynamics of "hammers". It's from p.10. If this doesn't ring a bell, look at the chart examples again.

I don't really care about all the hammer/doji/butterfly/spinning top blah blah jargon because none of that really matters. What does matter is that (a) the hammer—or a hammer-like candle—forms in the first place. That alone tells you something. What matters further is (b) HOW it forms. Price was at one point, plunged, then recovered dramatically to get back at, near, or even higher than it was in the first place. How far it gets and where it ends up (below the open, at the open, above the open) tells you something about demand. How far price dropped before it was driven back also tells you something about the players and how passionate they are. WHERE price bounced is also important, which is where support and resistance come in.

Therefore, to say that if price makes it back higher than the midpoint of the candle, it's a hammer, and if it doesn't, it's not, is beside the point. Or to say that it has to get back within a certain percentage of the high. Or that there can't be an upper tail. Etc. Etc. "Hammer" is just shorthand for a certain sequence of behaviors.

You're being told a story about a struggle. The story is continuous, even though you may segment it with bar intervals and timeframes. Your task is to learn the language in which the story is being told, which is largely the language of greed (or its first cousin once-removed, hope) and fear. If you imagine the effort that it takes on both sides to create that hammer, you'll have a better idea of what to do with it. Not every hammer has cosmic significance. Most don't amount to a hill of beans. If price falls out of a range, forms several down bars, then hits support and forms a hammer with a long tail, that carries more significance than a hammer which begins in the range, falls just barely out of the range, then closes right back in the range again as if nothing had happened.


Add to this what Wyckoff has to say about tests, technical rallies, retests, etc., and the "meaning" of price behavior during the last few months becomes easier to decipher.

--Db
 
dbphoenix said:
Not rhetorical at all. Since what you've advanced is the opposite of what I wrote, then I must not have explained it properly. On the other hand, if you're not applying what I wrote to the process you went through to arrive at your conclusions, then that represents a different avenue.

In any case, with regard to your particular question, where anyone "recommends" drawing the TL is largely irrelevant. The job of a TL is to show trend. It's not supposed to provide S/R and it doesn't. One can "believe" that it does, but I suggest examining evidence rather than beliefs.
--Db
Db,
I'm not clear: in what way do my comments negate what you wrote? I agree with you on TL's, and I don't view the one I drew - or any other TL for that matter - as support or resistance. However, as you have pointed out, lots of people do exactly this. I think it's useful to have a handle on how the crowd thinks and, therefore, how it is likely to act.
Tim.
 
One guideline (pun intended) I use is

Be Flexible. eg "Strict trend-line construction may be right according to the text book but may produce unusable results"
 
dbphoenix said:
I Price was at one point, plunged, then recovered dramatically to get back at, near, or even higher than it was in the first place. How far it gets and where it ends up (below the open, at the open, above the open) tells you something about demand. How far price dropped before it was driven back also tells you something about the players and how passionate they are.
--Db


Still waiting for strong signals
 
$compq

Lower highs, lower lows.
"Bozo's" + increased volume on declines.
Short ranges on advances- price is difficult to rise.
Fewer new highs, adv-decl volume diverging with price - no breadth behind the up moves.
Last two days- consolidation before further decline.
If there is another rise which should stop well off the last high it could be used for adding to shorts.

Special thanks to DB for his book and recommendations.
 

Attachments

  • 5.png
    5.png
    14.7 KB · Views: 274
  • 4.png
    4.png
    15.8 KB · Views: 289
  • 3.png
    3.png
    17.6 KB · Views: 252
  • 2.png
    2.png
    17 KB · Views: 304
  • 1.png
    1.png
    15.1 KB · Views: 315
contrakt said:
Still waiting for strong signals

The hammer, formed under the right circumstances, IS a strong signal. What one does with it is an entirely separate issue.
 
chessvirtuoso said:
Lower highs, lower lows.
"Bozo's" + increased volume on declines.
Short ranges on advances- price is difficult to rise.
Fewer new highs, adv-decl volume diverging with price - no breadth behind the up moves.
Last two days- consolidation before further decline.
If there is another rise which should stop well off the last high it could be used for adding to shorts.

The higher volume means only increased trading activity. To understand what that increased activity means, you have to look at what's happening to price. Price stopped declining in a particular place in a particular way. Whether the decline resumes or not is not at issue yet.

Don't concern yourself with what's going to happen. Focus instead on what's happening now. If you don't understand the latter, the former is just a guess. And even if you're trading the Naz itself, don't limit your focus to only one index.
 
$nya

dbphoenix said:
The higher volume means only increased trading activity. To understand what that increased activity means, you have to look at what's happening to price. Price stopped declining in a particular place in a particular way. Whether the decline resumes or not is not at issue yet.

Don't concern yourself with what's going to happen. Focus instead on what's happening now. If you don't understand the latter, the former is just a guess. And even if you're trading the Naz itself, don't limit your focus to only one index.

You are right that I jumped to hasty conclusions. Let me re-phrase.
The intermediate term advance is losing steam as indicated by the lower highs and decreased market breadth. However it is not by itself a reason to go short but rather to cover one's longs (if one failed to do so after the first lower high). A decisive breakdown below the current levels will indicate weakness and a beginning of a bear trend.
Thanks again.
 

Attachments

  • 1.png
    1.png
    15 KB · Views: 280
  • 2.png
    2.png
    17 KB · Views: 238
  • 3.png
    3.png
    18.1 KB · Views: 253
  • 4.png
    4.png
    15.3 KB · Views: 253
  • 5.png
    5.png
    15.6 KB · Views: 263
Indices

It is almost hilarious how I insist on breakdowns, declines ets. :cheesy:
The facts are that there is a high, a test and a lower high.
Whether or not the top has already finished forming or there is going to be another test is about to be seen. For now the sellers are stopped at current levels and the buyers will have to prove if they have the resolve to push the prices higher.
 
Last edited:
chessvirtuoso said:
You are right that I jumped to hasty conclusions. Let me re-phrase.

The task is not so much re-phrasing as re-focusing. You're far less likely to be open to the possibilities of going long if you develop and nurture a bearish bias. Therefore, again, focus on the present rather than the future. The goal is not to be right or wrong but to be prepared.

If this is unusually difficult for you, then take the opposite side and argue the bull view. This may at least move you nearer to neutral.
 
Top