Predicting the future maximum drawdown...

pecas

Member
Messages
75
Likes
6
... of a system, or a portfolio of systems.

It's a very interesting argument, because you can read how many books you want (I read some by Ralph Vince) on Money management, but all of them are based on the fact that you know, with reasonable certainty, the amount of the future maximum drawdown, i.e. how much you're gonna lose before you make new profits.
This is necessary because it affects your risk of ruin. How many shares to buy? How many contracts to sell? These are all questions you can't answer if you don't have a method to estimate the future maximum drawdown, even if you read Vince's "opera omnia".

I don't have an answer, but I'm trying to find one, and just today I made some good experiments that show how relying on the maximum drawdown found in tests, be it backtests or out-of-sample tests, is just not enough. Doubling that number just to stay safe (the future is always worse than the past) is as well arbitrary, and could be too prudent (not efficient) at times, and too risky other times.

I'll try to explain my experiments here (give me some hours) and would like to receive some feedback, and hopefully some contribution.
 
Last edited:
The first thing one should ask: is my system's next trade dependant on my system's recent trades?
I mean, is my system likely to deliver long winning streaks and long losing streaks, or the opposite, is my system likely to deliver a win/loss/win/loss type of return?

If this is the case, then you should definitely act and improve your system: in case #1, you should only trade after one win, and stop trading after one loss; in case #2 you should trade after a loss, and stop trading after a win.
But, quoting Ralph Vince, "Rarely, if ever, you will find a system that shows dependency involved that can be capitalized upon to make a substantial difference".

There is a way to determine mathematically your confidence that there is dependency: I used it, and found that none of my systems show dependency. Even in case a system does, you can easily step up from a system that shows dependency, to a system that doesn't, following the rules above for case #1 and case #2, making more money in the process.

So what's left? A system with no dependency. This means that past trades do not have any influence on future trades. Let's say my success rate is 50%: my next trade has a chance to win equal to 50%, if I just had 10 wins in a row, or 5 losses, it doesn't matter. Like a coin-toss.

So we have our first assumption: there is no dependancy between trades result. Is it wrong? "Rarely, if ever", according to Ralph Vince.
 
Last edited:
So we make our backtest and we have our system with a good profit, a good success rate, and a low maximum drawdown.
We allocate our capital with prudent money management, imagine a worst case scenario (max drawdown x 2?), and start trading.
All seems to go well, success rate is there, but bang! We hit a drawdown never seen before, and we have to stop trading.
We blame Greece, the Fed, Al Qaeda, Lehman... and after a while, we try again, with the same results.

I think the problem here is we relied on wrong expectations, and most of the times it's max drawdown to be a wrong indicator of what will happen in the future. Success rate and profit do have their variance, but if the system is good, they will be there. Not max drawdown.

This is because Max drawdown depends on the sequence of trades: suffice to say that if you just change the order of 10 trades, you may have 3,628,800 combinations. Yeah: 3 millions 628 thousands 8 hundred combinations. And every combination may have a different maximum drawdown.
 
Hello pecas, nice thread and in the right section of the forum. I am subscribing to your thread.

As you know, I am trying to solve similar problems by studying what the nobel prizes and academics say, e.g. markowitz. It might be too complex for me and there might be too much academic bull****, before reaching the page I need.

You decided to take the route of trading literature, which I do not trust, because some of them write books to make money. But they might get to the point faster than the authors I am reading. On the other hand, if you had a book on the same subject by a nobel prize and one by a trading author, which one would you trust more? That is why I am going for markowitz. The professors tend to be more interested in ideas than the trading authors, who seem to be more interested in making money by selling books.

Good luck.
 
I think you just have to take a practical approach to this problem.

What I try to do is to take historic trade results, and then create a range of theoretical equity curves based on resampling those results. If I've done say 2000 trades, I generate curves which include 2100 theoretical trades, so I'm kind of looking at what the curves might look like 100 trades into the future.

This gives me upper and lower boundaries that I'd expect to see over say the next week, month, quater etc.

If those boundaries are exceeded (either due to drawdown, or due to the system performing better than expected), I STOP trading that system. I trade a lot of sytems, so it kind of works for me.
 
Hello pecas, nice thread and in the right section of the forum. I am subscribing to your thread.

As you know, I am trying to solve similar problems by studying what the nobel prizes and academics say, e.g. markowitz. It might be too complex for me and there might be too much academic bull****, before reaching the page I need.

You decided to take the route of trading literature, which I do not trust, because some of them write books to make money. But they might get to the point faster than the authors I am reading. On the other hand, if you had a book on the same subject by a nobel prize and one by a trading author, which one would you trust more? That is why I am going for markowitz. The professors tend to be more interested in ideas than the trading authors, who seem to be more interested in making money by selling books.

Good luck.
I will definitely come back to your thread and watch all those videos you posted, but it's gonna take a while. I fear some hours was too optimistic, I will need some days just to explain my experiment in detail.
Good point on the professors.
 
I think you just have to take a practical approach to this problem.

What I try to do is to take historic trade results, and then create a range of theoretical equity curves based on resampling those results. If I've done say 2000 trades, I generate curves which include 2100 theoretical trades, so I'm kind of looking at what the curves might look like 100 trades into the future.

This gives me upper and lower boundaries that I'd expect to see over say the next week, month, quater etc.

If those boundaries are exceeded (either due to drawdown, or due to the system performing better than expected), I STOP trading that system. I trade a lot of sytems, so it kind of works for me.
Very interesting. And very similar to what I'm gonna do here, if I get your post correctly.
How do you resample your 2000 trades? Do you just change their sequence or do you generate new trades based on average win/loss and standard deviation? And, maybe same question, how do you generate the new 100 trades?
 
How do you resample your 2000 trades? Do you just change their sequence or do you generate new trades based on average win/loss and standard deviation? And, maybe same question, how do you generate the new 100 trades?

The simplest analogy is to assume that the result of each of the 2000 trades is writen on a piece of paper, and then all of the bits of paper are put in a box and given a shake.

You pick out a trade result at random out of the box, and write down the result. Put the bit of paper back in the box and give it another shake, then pick out a new result, write that one down. Keep doing that till you have 2100 trades. Then use those trades to generate an equity curve. Repeat maybe 10,000 times to get a bunch of curves and determine statistcal boundaries and confidence intervals etc.

I dont really like the idea of using a mean and std deviation, in my case the distribution of gains and losses isnt normally distributed as losses tend to be cut quite rapidly, and the profit side of the distribution has fat tails.
Yes this is exactly what I'm doing, except for putting back into the box the bit of paper... basically I shake off the box and pick out all of past trades. Now that I think of it, your method seems better than mine though: it allows for different success rates in different periods, and also allows to create brand new theoretical trades to better estimate the future.
And yes what I was going to illustrate is the same thing you do: repeat the process 10,000 times, and get the distribution of max drawdowns to determine the confidence intervals.
And yes #3 about using mean and std deviation, my wins/losses are not distributed normally as well.
 
OK, I coded a script to do what I want to do. I incorporated the suggestions by the hare in his post above.

I'm not a programmer, and my code sucks; so:
- the script is slow and the code is hard to understand
- it is coded in Autoit, because I can't code in other languages
- it works perfectly :)

If you don't know what Autoit is, it's a tool to automate tasks in Windows. It can interact with Excel. It's free and you can find it here: www.autoitscript.com.

The code is here, else you can just find it in my attachments, provided you downloaded and installed Autoit:
Code:
#Include <Excel.au3>
#Include <GUIConstantsEx.au3>
#Include <Array.au3>
#Include <Math.au3>
#Include <ProgressConstants.au3>

While ProcessExists("EXCEL.EXE")
	ProcessClose("EXCEL.EXE")
WEnd


;create GUI
$GUIHandle=GUICreate ( "Trading system simulation" , 500 , 450 , 0 , 0)
GUISetState (@SW_SHOW,$GUIHandle)
;path to Excel file containing past trades
GUICtrlCreateLabel ( "File to analyze:", 50, 50 , 400 , 20)
$input1=GUICtrlCreateInput ( "C:\Documents and Settings\Administrator\My Documents\Simulation.xls", 50, 70 , 400 , 20)
;number of past trades
GUICtrlCreateLabel ( "Number of trades in backtest:", 50, 100 , 400 , 20)
$input2=GUICtrlCreateInput ( "637", 50, 120 , 400 , 20)
;number of theoretical trades to create
GUICtrlCreateLabel ( "Number of future trades to create:", 50, 150 , 400 , 20)
$input3=GUICtrlCreateInput ( "637", 50, 170 , 400 , 20)
;number of iterations
GUICtrlCreateLabel ( "# of iterations:", 50, 200 , 400 , 20)
$input4=GUICtrlCreateInput ( "10000", 50, 220 , 400 , 20)
;path to Excel file to save for results
GUICtrlCreateLabel ( "Save results to:", 50, 250 , 400 , 20)
$input5=GUICtrlCreateInput ( "C:\Documents and Settings\Administrator\My Documents\Result.xls", 50, 270 , 400 , 20)
;start button
$button=GuiCtrlCreateButton("Start", 150, 320, 200, 20)
;progress bar
$label=GUICtrlCreateLabel ( "Progress...", 50, 350 , 400 , 20)
$progressbar=GUICtrlCreateProgress ( 50, 370 , 400 , 20, $PBS_SMOOTH)

;GUI message loop
While 1
	$msg=GUIGetMsg()
	If $msg=$button Then ExitLoop
	WEnd
	
;disable GUI controls	
GUICtrlSetState ($input1, $GUI_DISABLE)
GUICtrlSetState ($input2, $GUI_DISABLE)
GUICtrlSetState ($input3, $GUI_DISABLE)
GUICtrlSetState ($input4, $GUI_DISABLE)
GUICtrlSetState ($input5, $GUI_DISABLE)
GUICtrlSetState ($button, $GUI_DISABLE)
	
;read GUI inputs
$readpath=GUICtrlRead($input1)
$oldtrades=GUICtrlRead($input2)
$newtrades=GUICtrlRead($input3)
$nit=GUICtrlRead($input4)
$savepath=GUICtrlRead($input5)

;set the dimension of trade arrays
Dim $backtest[$oldtrades]
Dim $sample[$newtrades]
Dim $cumulative[$newtrades]
Dim $drawdown[$newtrades]
Dim $profit[$nit]
Dim $maxdrawdown[$nit]
Dim $profitdistribution[100]
Dim $maxdrawdowndistribution[100]

;read past trades and store them into backtest array
$oExcel=_ExcelBookOpen($readpath,0)
For $i=1 To $oldtrades
	$backtest[$i-1]=_ExcelReadCell($oExcel,$i,1)
Next
_ExcelBookClose($oExcel,0)


;iterate
For $iteration=1 To $nit
	
	;create new sample of theoretical trades picking random past trades
	For $trade=0 To $newtrades-1
	 $sample[$trade]=$backtest[Int(Random(0,$oldtrades))]
	Next
	
	;create cumulative profit array
	$cumulative[0]=$sample[0]
	For $tradetoadd=1 To $newtrades-1
		$cumulative[$tradetoadd]=$cumulative[$tradetoadd-1]+$sample[$tradetoadd]
	Next
	
	;create drawdown array
	If $cumulative[0]>=0 Then
		$drawdown[0]=0
	Else
		$drawdown[0]=$cumulative[0]
	EndIf
	For $drawdowntoadd=1 To $newtrades-1
		$drawdown[$drawdowntoadd]=_Max(_ArrayMax($cumulative,1,1,$drawdowntoadd),0)-$cumulative[$drawdowntoadd]
	Next
	
	;retrieve profit and max drawdown
	$profit[$iteration-1]=$cumulative[$newtrades-1]
	$maxdrawdown[$iteration-1]=_ArrayMax($drawdown,1,1,$newtrades-1)
		
	;set progress bar
	$progress=$iteration*100/$nit
	GUICtrlSetData($progressbar, $progress)
	
Next

;open Excel book to save results to
$oExcel=_ExcelBookOpen($savepath,0)

;set progress bar
GUICtrlSetData($label,"Completing...")
GUICtrlSetData($progressbar, 0)
	
;determine profit and max drawdown granularity for distribution chart
$profit_granularity=(_ArrayMax($profit,1,0,$nit-1)-_ArrayMin($profit,1,0,$nit-1))/100
$maxdrawdown_granularity=(_ArrayMax($maxdrawdown,1,0,$nit-1)-_ArrayMin($maxdrawdown,1,0,$nit-1))/100
	
;sort profit and max drawdown arrays in ascending order
_ArraySort($profit)
_ArraySort($maxdrawdown)

;search for confidence intervals
For $iteration=0 To $nit-1
	If $profit[$iteration]>0 Then
		ExitLoop
	EndIf
Next
$string3=($nit-$iteration)/$nit
_ExcelWriteCell($oExcel,$string3,1,4)
_ExcelWriteCell($oExcel,$profit[$nit/100*10-1],2,4)
_ExcelWriteCell($oExcel,$profit[$nit/100*5-1],3,4)
_ExcelWriteCell($oExcel,$profit[$nit/100*1-1],4,4)
_ExcelWriteCell($oExcel,$maxdrawdown[$nit/100*90-1],5,4)
_ExcelWriteCell($oExcel,$maxdrawdown[$nit/100*95-1],6,4)
_ExcelWriteCell($oExcel,$maxdrawdown[$nit/100*99-1],7,4)

;calculate average profit and max drawdown
$profitsum=0
$maxdrawdownsum=0
For $i=0 To $nit-1
	$profitsum=$profitsum+$profit[$i]
	$maxdrawdownsum=$maxdrawdownsum+$maxdrawdown[$i]
Next
$averageprofit=$profitsum/$nit
$averagemaxdrawdown=$maxdrawdownsum/$nit
_ExcelWriteCell($oExcel,$averageprofit,8,4)
_ExcelWriteCell($oExcel,$averagemaxdrawdown,9,4)
	
;set array indexes to start search from
$profitindex=0
$maxdrawdownindex=0
	
;group profit and maxdrawdown to plot distribution
For $i=1 To 100
	$minprofit=$profit[0]+($i-1)*$profit_granularity
	$maxprofit=$profit[0]+$i*$profit_granularity
	$minmaxdrawdown=$maxdrawdown[0]+($i-1)*$maxdrawdown_granularity
	$maxmaxdrawdown=$maxdrawdown[0]+$i*$maxdrawdown_granularity
		
	While 1
		If $profitindex>=$nit Then ExitLoop
		If $profit[$profitindex]<$maxprofit Then
			$profitdistribution[$i-1]+=1
			$profitindex+=1
		Else
			ExitLoop
		EndIf
	WEnd
		
	While 1
		If $maxdrawdownindex>=$nit Then ExitLoop
		If $maxdrawdown[$maxdrawdownindex]<$maxmaxdrawdown Then
			$maxdrawdowndistribution[$i-1]+=1
			$maxdrawdownindex+=1
		Else
			ExitLoop
		EndIf
	WEnd
		
	;write values to Excel
	$string1=Round($minprofit,2)&"-"&Round($maxprofit,2)
	$string2=Round($minmaxdrawdown,2)&"-"&Round($maxmaxdrawdown,2)
	_ExcelWriteCell($oExcel,$string1,$i+10,1)
	_ExcelWriteCell($oExcel,$profitdistribution[$i-1],$i+10,2)
	_ExcelWriteCell($oExcel,$string2,$i+10,3)
	_ExcelWriteCell($oExcel,$maxdrawdowndistribution[$i-1],$i+10,4)
		
	;set progress bar	
	GUICtrlSetData($progressbar, $i)
Next

_ExcelBookClose($oExcel,1)
GUIDelete($GUIHandle)
MsgBox(0,"Trading system simulation","Done")

Instructions:
1. download attachments
2. place Excel sheets in folder "C:\Documents and Settings\Administrator\My Documents". If you don't have this folder, place them where you want, but you will have to edit the code later
3. in simulation.xls, you must delete column A, and paste the results, in dollars, of your system past trades. No date, no time, nothing but the result in dollars of each trade, which must be in column A starting from row 1. Save, and take note of how many trade results you have just pasted.
4. install AutoIt
5. open the attached file "drawdown simulation2.au3" with "Scite script editor"
6. if your Excel files are in a different folder than specified above, you must edit lines 17 and 29 of my code to have the right path to the files.
7. In Scite script editor, Tools-->Go will run the script
8. In the window that just appeared on top left, the paths should be OK if you followed previous instructions. Edit "number of trades in backtest" (you took note at #3), edit "Number of future trades to create:" (a good number is the same as trades in backtest), edit number of iterations (I use 10000 and looks fine, although it gets slow quickly as the number of trades in test gets high... it takes a couple of hours here with 637 trades in backtest. Suggestion: try with 20 iterations on 1st attempt, just to see if it works)
9. Click on Start and let it finish. At the end, the window will disappear, and a small window with "Done" will appear. If this doesn't happen, something went wrong.
10. Now that you clicked OK on the "Done" message, go open your Result.xls file: you will find useful info about future possible profits and max drawdown. If needed, Save the file with another name, because next time you run this script, Result.xls will be overwritten.

That's it: feedback is welcome.
 

Attachments

  • Sheets.zip
    20.5 KB · Views: 341
  • drawdown simulation 2.zip
    1.9 KB · Views: 344
Last edited:
While my current view that the concept of attempting to calculate future anything is a quite pointless task, I haven’t always been such a miserable curmudgeon and remember being gung ho on all this really interesting stats stuff. So, FWIW:-

Chande’s method involves nothing more complex than multiplying your monthly standard deviation by 5.

But even the more complex manoeuvres in this area still require a nod to standard deviation regardless of whether you are considering a constant or stochastic volatility model so I’m not sure you can so easily disregard SD as bunny suggests.

Mean return and variability of return are key. As is quantity of data of course. While from a professional perspective you would be justified in expending the effort to provide a realistic (LOL) value for this parameter, it is largely meaningless from an operational trading viewpoint and possibly even counter-productive for a retail trader with insufficiently lengthy track record.
 
... of a system, or a portfolio of systems.

It's a very interesting argument, because you can read how many books you want (I read some by Ralph Vince) on Money management, but all of them are based on the fact that you know, with reasonable certainty, the amount of the future maximum drawdown, i.e. how much you're gonna lose before you make new profits.
This is necessary because it affects your risk of ruin. How many shares to buy? How many contracts to sell? These are all questions you can't answer if you don't have a method to estimate the future maximum drawdown, even if you read Vince's "opera omnia".
.

Use whatever value feels right, based on experienced judgement and backtesting.

Now if your worst case expected drawdown is exceeded in real world trading, and at some point it probably will be, then you want to start reducing your position size down quickly.
 
That calculator doesn't make any sense.

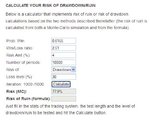
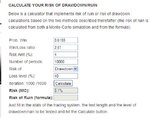
Yes it does. You can measure the probability of a certain drawdown occurring over a specified number of iterations/trades.

So for the example, the chance of a 30% drawdown over 10k trades at the win%, R:R and Risk amount if 77.9% and for 40% it's 5.1%.

Or am I missing something here? You just run it and run it to get the upper and lower bounds.
 

Attachments

  • 30pc.JPG
    30pc.JPG
    36.7 KB · Views: 554
  • 40pc.JPG
    40pc.JPG
    37.4 KB · Views: 654
While my current view that the concept of attempting to calculate future anything is a quite pointless task, I haven’t always been such a miserable curmudgeon and remember being gung ho on all this really interesting stats stuff. So, FWIW:-

Chande’s method involves nothing more complex than multiplying your monthly standard deviation by 5.

But even the more complex manoeuvres in this area still require a nod to standard deviation regardless of whether you are considering a constant or stochastic volatility model so I’m not sure you can so easily disregard SD as bunny suggests.

Mean return and variability of return are key. As is quantity of data of course. While from a professional perspective you would be justified in expending the effort to provide a realistic (LOL) value for this parameter, it is largely meaningless from an operational trading viewpoint and possibly even counter-productive for a retail trader with insufficiently lengthy track record.
You're overestimating what i'm trying to do here, probably it's my ambitious thread title.
When I backtest a system I find a max drawdown value. I want to know if that value was likely to happen, give that sequence of trades, or if it was just a lucky combination (or unlucky, for that matter).
If it happens again in the next cycle, that's definitely hard to estimate, but at least I know what to expect as a likely result if the system continues producing, and I know what an "out of bounds" result looks like, making it easier to identify if/when the system is not working anymore.
 
I fixed a bug in the script, regarding the confidence intervals of future profit.
I see there had been only 1 download of my script. Please download again.
The code posted has been edited as well.
Sorry for this.
 
When I backtest a system I find a max drawdown value. I want to know if that value was likely to happen, give that sequence of trades, or if it was just a lucky combination (or unlucky, for that matter).
If it happens again in the next cycle, that's definitely hard to estimate, but at least I know what to expect as a likely result if the system continues producing, and I know what an "out of bounds" result looks like, making it easier to identify if/when the system is not working anymore.
Every piece of performance data you extract from any given series of contiguous price data is idiosyncratic.

But even if you choose not to agree with that, it’s rare for any trader to go all the way to the ‘out of bounds’ scenario. Paradoxically, those that do tend to have invested (quite literally) so much into that losing position, they’ll more likely sit on it rather than kill it, or even as DD suggests, simply reduce exposure.

Reaching maximum drawdown or maximum consecutive losing trades (that used to be my favourite) before considering the system a loser overall are the prime benchmarks for evaluation of back-tested systems. But that is an industry in itself and of little relevance to the realities of trading.

Just my view.
 
Hi,...Nice thread topic. I must tell you that recently I have been studying EXACTLY this and other stats on a trading system I am developing. I have done extensive reading and testing and I will sum up my findings for you about Max DD. BOTTOM LINE,...your Probability win rate determines your max drawdown and risk of ruin. People say that having a HIGH win rate is not important for a winning system and this is true. However, win rate will NOT effect profitability,...It effects draw down and risk of ruin. Take the extremes for example....a lottery like POWERBALL LOTTO with say 1 in 60 million chance of winning $50 Million dollars. IF you are that 1 in 60 million winner you have a large profit...win rate does not effect profit. However, you could spend >60 million dollars (assuming tickets cost $1 each) just to make that $50 mill. THAT is also assuming you make every combinaton of possible ticket numbers ONLY ONCE....However, as in trading you could have multiple losing trades in a row by effectively pulling the same numbers randomly (ie making the same trade...or pulling the same marble/paper out of the bag of marbles). The LOWER THE WIN RATE the HIGHER THE LIKELIHOOD OF HIGH STRING OF LOSERS!!!....that is the key!! Since higher string of losers would ultimately effect a larger drawdown you would have a high risk of ruin with HUGE draw downs as win rate goes down.

The opposite is true of HIGH win rate. Say you have a 90 % win rate then your draw down is Very low!! Every time you place a trade you have 90% chance of a win and so your acct will not likely lose money even if you only make a small profit on each trade. Again Win rate does NOT effect profit ONLY DRAW DOWN. I will post information I have posted on another forum on this same topic. In those posts that will follow here I will show you in more detail what i mean and provide solid examples with statistcal analysis to show what I mean.

Also, it is key that you realize that what someone above said about picking a piece of paper and then writing down trade result and then PLACING THE PAPER BACK is absolutely CORRECT. Your prior trades DO NOT effect subsequent trades. If I flip a coin 10 times and the first 4 are all heads does that influence the 5th time I flip a coin....NO....I still have a 50% chance of heads or tails. You can have as many as 10 heads or all 10 tails and obviously any combo in between. So ech coin flip (think trade) has NO bearing on future coin flips. You just know that if you flipped a coin say 2 million times that ON AVERAGE you would have 1 million heads and 1 million tails but there could be strings of each interspersed.

I hope this helps...see my following posts that I will copy from posts I made on another forum.

BTW the statistical analysis you should be doing is a Monte Carlo Simulation wherby you run the same 100 or 200 trades OVER and OVER again 10,000 times. Thats 2,000,000 trades and should give you a distribution of the samples that your system generates. I will refer to these in the future posts with charts I will post.

Good Luck
 
Last edited:
Quote from intradaybill:

Irreleavant statistic. The most important ststistic IMO is the profit factor. Must be bigger that 1.75. Then you are doing well. You can have 90% win rate and still get ruined.
--------------------------------------------------------------------------------


It absolutely is relavant!!! It is MUCH harder to face ruin with 90% win rate than 10%. It all factors together is my point. All of these issues, profit factor, expectancy, and probability of winning trade, and standard deviation between each trade's win and losses also play a role in your overall performance. However, a higher win rate reduces drawdown which HELPS reduce your volatility of your account's equity. The more times your trade is a winner (even if small) will minimize your string of losses and minimize drawdown. With lower probability trades you need bigger profit wins to make up for the multiple losses in a row you would face. I would MUCH rather have a system with 0.3R expectancy and 90% win rate than a 0.4R expectancy and 10% win rate.

Lets say you have a system that has 0.3R expectancy so in 10 trades you have 9 that make on average 0.44R and one 1R loser with total win of 3R in 10 trades = 0.3R Now take a system with 9 losses in a row of 1R each. Your last win would have to be 13R to make up for the 9R losers and make4R divided by 10 trades = 0.4R expectancy in 10 trades. However, because each trade is INDEPENDENT of what occurred on the prior trade it does not matter whether the prior trade won or lost as the prior trade does NOT INFLUENCE the next trade. So your chance of a loss is STILL 90% on the next trade. You easily could rack up 20+ losers in a row with this system and likley only rack up a max of about 2-3 winners in a row. Over 10,000 trades this may all even out but few of us would have the conviction to trade a 90% losing system with HUGE drawdowns of 20 losers in a row or more. Do a Monte Carlo analysis on a system like this and you will see what I mean. This is a poor system to trade...you are better off flipping a coin (50:50) for your trade direction.

This has been explained in GREAT detail in "The Definitive Guide to Position Sizing" by Dr. Van K Tharp for those that are interested in reading more about this.

Again, probability is NOT the end all be all of trading but it sure as hell helps!!!

(If you have read this far notice that I was having a discussion about reducing risk per trade to 0.1% per trade and 1% per trade. Some one suggeted that this would reduce drawdown and volatility. NOtice that 0.1% risk on a low win rate does NOT effect volatility of the system equity.)
 
Last edited:
Top