Predicting the future maximum drawdown...

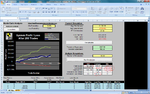
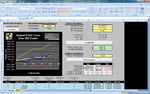
OK,...here is a MC Sim for 2 different systems. BOTH systems will have a 0.4R Expectancy and assume a starting capital of $100,000. The first system has a win rate of 10% and the second 90%. These are the ONLY differences in the systems. Both MC simulations are done and posted below. Both simulations are of 200 trades simulated 10,000 times!!! This is 2,000,000 trades.

Both MC sim are done using ONLY 0.1% capital at risk per trade. Notice that this is considered EXTREMELY conservative by most standards as most would say 0.5-2% risk is typical for trading. The ONLY reason I have included this 0.1% risk MC Sim is to show that at 0.1% capital at risk you could still have significant draw downs and wide possibilities of outcomes in trading with a 10% system. This 0.1% was also the amount of risk that intradaybill mentioned in a prior post as if that is somehow going to prevent draw down. It does not. It only reduces the rate of bleed and possible ruin. Realize also that everyone has a different definition of ruin. For me 20-25% draw down I would consider ruin. For others this number may be 50% or 100%. Everyone has to decide for themselves what that number is.

Notice that the 10% system has a PEAK of $37,000 GAIN and nearly -$12,000 LOSS. Also notice that the longest string of losers is 33!!!! The longest string of winners is 2!! NOTICE THAT AVERAGE WIN WAS $9500 OVER THE ENTIRE SIMULATION!!!! THIS IS IDENTICAL TO THE AVERAGE WIN FOR THE 90% SYSTEM.

(sorry about the ALL CAPS,..I can not figure out how to bold something here..LOL)

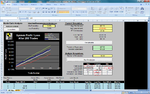
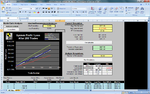
Compare that to the 90% system. Peak win is certainly lower but so is the peak draw down. This system has a max Draw down of -$370. Also notice that ALL of the simulations produced a NET profit even the MINIMUM profit was $7,000 (7%). Point is that the 90% system has less draw down and ZERO possibility of ruin and 100% chance of a winning year.

The obvious question is now for the 90% system with ZERO chance of a losing year am I risking too little per trade? I would say the answer is YES. You could do MUCH better with this system by only changing the amount risked per trade. Lets see what happens with 1% at risk,....to be continued below.

First pic is 10% system at 0.1% risk. Second one is 90% system at 0.1% risk.
 

Attachments

  • 10 percent.png
    10 percent.png
    168.5 KB · Views: 414
  • 90 percent.png
    90 percent.png
    169.3 KB · Views: 486
Ok so now lets look at the SAME systems with a 1% risk of capital per trade. Again lets assume a $100,000 starting capital. Again 200 trades simulated 10,000 times.

Notice that now the risk of draw down goes up even with the 90% system. However, also notice that in the 90% System the MINUMUM is still a $50,000 Win. Thats 50% folks!! Nothing to sneeze at as a MINUMUM win. MAX is $103,000. This suggests that even more risk could be taken with this system and maximize gains.

Notice that the 10% system has a MAX Draw down of $101,000!!! YIKES!!. MIN P/L with this system is -$100,500 LOSS!!! That is complete RUIN by anyone's definition. I do realize that the MAX Gain is higher with this system but that is only because of the higher profit of the winners when they occur. This is the same a intradaybill was describing "Trend Following Mutual Funds" that have trades that win for months & years (large R gain) for MANY small (1R) losses. Again the AVERAGE win for BOTH systems is about $80,000 (give or take a little)

So,...Probability of win IS RELEVANT!!! Realize one last thing that ALL MC Sim assumes the trader will trade the system EXACTLY the same as when the stats were collected and that the stats are a good representation of the market that will come in the future. It also assumes that you will trade it 100% mechanically and that your emotions will not falter. I dare say that anyone's emotions would come into play after a string of 33 losses with the 10% system. So your results will likely be less than the MC simulation. So with a 90% system you have room for error,...NOT SO MUCH with 10%.

I hope this clears things up a bit....Good Luck!

First = 10 % system at 1% risk and Second = 90% system at 1% risk.
 

Attachments

  • 10 percent - 1.png
    10 percent - 1.png
    175.5 KB · Views: 429
  • 90 percent -1.png
    90 percent -1.png
    174.1 KB · Views: 442
Last edited:
So with a 90% system you have room for error,...NOT SO MUCH with 10%.[/B]

I hope this clears things up a bit....Good Luck!

First = 10 % system at 1% risk and Second = 90% system at 1% risk.

The only 90% systems i know of, are the ones that go by names like; "Forex Robot Destroyer", "Forex Predator", "I'm going to eat your lunch for you - MK2", and "Here Comes the Big Bad Wolf Money Hoover".
 
This is a very useful thread for me, so I hope it will keep going. I think a question mark should have been added at the end of its title, because as I have been studying a little bit of probability (being math illiterate), I have increasingly realized that it's not possible to predict the future maximum drawdown, which is potentially infinite. After a lot of thinking, and losing, I have understood the problem is:
1) how to appraise the probability of x future maximum drawdown
2) how to build a portfolio so to optimize (reduce the probability/size of) the... "most likely" future maximum drawdown

I just found a related link on the subject:
Reliability of the Maximum Drawdown
...For this reason, it is better to judge risk from observed volatility than from observed maximum drawdown.
I understand little of what it says, but it's definitely related to this thread and maybe similar to something Vince says, and, even though I didn't read almost anything by him (just a few lines), he seems to say that drawdown is not very useful. Here's two links to his books in .pdf (which hopefully I will be able to read within the next few years):
Portfolio Management Formulas - Ralph Vince..pdf
http://www.fxf1.com/english-books/MathematicsMoneyManagement.pdf

The math discussed on this thread is too advanced for me ("montecarlo simulation", etc.) but I hope the discussion will continue (hopefully simplified or I won't understand), so I can learn something more. It was useful for me to read here (more than one person said it) and understand how previous trades do not affect subsequent trades, as in a coin toss experiment. At first it didn't seem right, but later I was convinced of this, even though I'd like to point out that it holds true only as long as we're not talking about a system that only goes long on a future like the SP500, because in that case, the more it falls and the more it's likely to rise. In that case, we could not say that previous trades do not affect future trades.

Here's some more good links related to this thread:
Risk of Ruin
Risk of Ruin Index
TraderFeed: How to Avoid Risk of Ruin in Trading
 
Last edited:
Have you ever tried using statistics to determine the expected drawdown, in place of using the backtested drawdown. Statistical worst case scenario will usually give you a more accurate measurement of future drawdown.
 
Yes, I think I've been trying to use something similar maybe (according to what I've understood of your post). I'll try to explain my idea. I've been noticing that the concept of backtested maximum drawdown is not as useful as the concept of... variability, of the frequency of falls, in other words of the (backtested, once again) drawdown from every point on the (backtested) equity curve to the subsequent lowest point. For example, I would say that, always within backtested data, a portfolio of systems (or a system) whose maximum fall peak-to-trough is 10k but has no other >9k falls, could still be better than a portfolio of systems (or a system) that has a smaller max fall, but a lot of >9k falls. With my limited math knowledge, i can see this is related to the way sharpe ratio measures performance and variability, but I see that sharpe ratio gives me a ratio of profit vs variability, and that it doesn't give me the same information as to my risk of blowing out with a given capital, according to the past behaviour (back-tested data).

Anyway, once I started to think in terms of probability theory (which I ignored completely until recently), and once I understood that maximum drawdown is not a guarantee of future performance but only an approximate indication, I also realized that there's other, more accurate, ways to forecast my probabilities of success/failure.
 
You can control max drawdown size through position sizing.. however you cant control how long a drawdown will last ( at least not without abandoning your system).

Here is a chart of Dunn Capital fund performance, long term trend following.. note the 7 year long drawdown starting around year 2004.
Prior to that the largest drawdowns were 'only' about 2 years long. This is reason long term trend following is so hard to do without giving up, most people cannot take even a 1 year drawdown let alone a 7 year one.

comp1.jpg
 
I have just finished listening to an audiobook: “Fooled by randomness”, by Nassim Nicholas Taleb, that discusses maximum possible historical drawdowns / trading disaster scenarios, tying it in to montecarlo analysis, survivorship bias etc. No formulas in it though, just general explanations. It was interesting to me because he talks about the traits of potentially ruinous risk taking and of conservative risk management, I could physically point at examples of both as I was listening to it.
Sorry – I know its just another book, but its an audio book, so its good for a walk or something. (Its 10 hours though, so thats a long walk.)
 
Thanks for the chart, donaldduke. I understand what you say. If you trade systems on futures and have a low capital however, position sizing is not possible. In my case, I'd need about 200k for position sizing. Silver requires 30k of capital for example. To do position sizing with that one, even without considering the drawdown, one would need at least 200k.

Regarding the book, earthling, I feel most books have a tendency to show off knowledge rather than teach useful things, but in this case he might be worth a shot, and he might teach me to think in terms of probability, a bit more than I do now. I know how to find .pdf files for free, but this idea of audiobooks is appealing as I don't like to read. Maybe I'll listen to it when I am trying to fall asleep. I might look for it on emule one of these days.
 
Last edited:
Travis you can borrow audio books from libraries. If you know how to find .pdf files or movies for free, try looking in the same place for audio books. I just googled emule, yes, that looks like exactly the sort of site. Be careful of viruses though, that’s my fear about the free sites.

I know what you mean about not liking to read, especially because it requires specifically allocated time to do it, and reading books off a screen makes me sleepy. Audio books are great, you can take time off from chart watching and still be ”working” by listening to your ipod while you exercise or cook or whatever.
 
Ok, when I get on emule, I will use the string "audio taleb" and similar. Yeah, viruses is a big concern on emule, but with .pdf and audio files the risk doesn't exist. It happens instead with maybe even the majority of .exe files.

Yes, audio book is a great concept.
 
... of a system, or a portfolio of systems.

It's a very interesting argument, because you can read how many books you want (I read some by Ralph Vince) on Money management, but all of them are based on the fact that you know, with reasonable certainty, the amount of the future maximum drawdown, i.e. how much you're gonna lose before you make new profits.
This is necessary because it affects your risk of ruin. How many shares to buy? How many contracts to sell? These are all questions you can't answer if you don't have a method to estimate the future maximum drawdown, even if you read Vince's "opera omnia".

I don't have an answer, but I'm trying to find one, and just today I made some good experiments that show how relying on the maximum drawdown found in tests, be it backtests or out-of-sample tests, is just not enough. Doubling that number just to stay safe (the future is always worse than the past) is as well arbitrary, and could be too prudent (not efficient) at times, and too risky other times.

I'll try to explain my experiments here (give me some hours) and would like to receive some feedback, and hopefully some contribution.

Look up to concept of variance.
You simply can't know this with 100% accuracy but you can give yourself a rough idea if you keep stats and you measure win ratios, reward, MAE, MFE, etc.
 
@all,

for estimating a possible maxDD (premise: the market conditions in the simulation runs are like in the past and the system functions...) it's enough to have the backtest results, the system report etc. It's even not necessary to have the price or trades list to realize a profound MCS stress test.

Specially for the premise of changing market conditions and/or concerning the development of "many markets - many time frames"-systems MCS methods can also be use for the generation of synthetic data (based on the original historical data feed) for additional backtesting.

More Info here:
www.zentrader.de - trading system development and monte carlo simulation methodology ...

bye
Volker
 
Yes, I have seen your website. Congratulations on all your work. I have a very weak theoretical background in probability and I don't know anything about Monte Carlo Sampling/Simulation, but I have a lot of experience with trading systems nonetheless. From what I understood on my own about probability, I took the trades by the systems in my portfolio, multiplied them by ten times, and I mixed them up several times (on excel, by assigning the "rand()" function to each trade, and then re-ordering them according to the random number generated).

What came from such resampling (cfr. this post) was very consistent results (from running several such random samples), which for example estimated at about 20% my probability of blowing by trading the selected portfolio with a given capital. And that was twice as bad as the backtested data was telling me, which was a 10% risk of blowing out. As i said, I did that "resampling" several times and it returned very similar results. I hope I can call it "resampling" and that I am not misusing the term.

Seeing that my back-tested results for drawdown were actually better than if those same trades had happened randomly, i figured these worse values would be closer to reality than my original backtested results, which might have suffered from curve-fitting of the portfolio (by discarding those systems that caused the combined drawdown to be too high).

Indeed, what more could I expect from my systems than to produce trades in a random order? It would be a dream if they were all uncorrelated. So, i figured, how can I be getting results that are better than if they were uncorrelated? This would mean they're inversely correlated, but this is more likely to be caused by curve-fitting (enabling only the systems that produced trades that fit well together, out of randomness, and therefore not likely to happen again), than by the quality of the systems, so I should rule that possibility out.

So I think this method I devised might have something good, but I have no idea if and how it's related to Monte Carlo Sampling. Also, I am not likely to buy any software, because I never buy anything, but also because I don't like to use anything unless I understand exactly what it's doing. I'd rather do it myself on excel, even if it is simpler and less powerful, because I believe it's better to have something limited and simple, that I understand, than something very promising, but that I can't understand.
 
Last edited:
@Travis,

you're right. Monte Carlo Simulation concerning trading system backtests in the the case of (a)system simulation (stress test) can be reduced to a kind of "trade sampling". In the case of (b)data simulation this is a resampling of data time series under specific conditions and rules.

So Monte Carlo Simulation methods are not complicate, they are instead easy to implement (if you know your genre - here: development of trading systems) and they serve the purpose of simulating scenarios which cannot be analyzed using existing data (or scenarios which are to be far to expansive to model in reality).

In the case of trading system backtesting we only have proved data for max. 80 years (e.g. Dow Jones Index), normally far fewer. So it makes a difference to get a time period of more then 1 million years thru MCS simulation methods...

bye,
Volker
 
Top