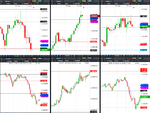
Predicting future FX support and resistance levels using mathematics

GBPUSD, EURGBP, EURUSD, USDCAD & EURCAD ---- PREDICTIONS PROVIDED IN YESTERDAY'S POST 10:15 PM T2W LOCAL TIME

GBPUSD, EURGBP, EURUSD, USDCAD & EURCAD results for 4th June 2020


Volatility Response Model (VRM) described in the first post of this thread.

EURCAD added to complete another triplet. Now there are two triplets.

EURGBP X GBPUSD = EURUSD

EURUSD X USDCAD = EURCAD

The FX pairs follow each other about their respective VRM levels. Good for additional trading signals !

The daily VRM charts below now only display the highest , lowest and S1 sentiments levels. These are the most important sentiment levels.

2 FILES ATTACHED - ALL LEVELS IN THE ATTACHED CHARTS WERE ON LAST POST

FIRST TWO FILES

Show consecutive charts covering the full 24 hours


Weekly VRM levels in the top 30 minute charts. Daily VRM levels in the bottom 30 minte charts . Daily VRM levels only valid for the last 24 hours. Times are GMT-3. EMA channel (4,7) included. All charts show the mid-price between the bid and the offer.
 

Attachments

  • 2020-06-04-1135-GBPUSD-EURGBP-EURUSD-USDCAD-EURCAD-30min-30min.png
    2020-06-04-1135-GBPUSD-EURGBP-EURUSD-USDCAD-EURCAD-30min-30min.png
    316.5 KB · Views: 125
  • 2020-06-04-1800-GBPUSD-EURGBP-EURUSD-USDCAD-EURCAD-30min-30min.png
    2020-06-04-1800-GBPUSD-EURGBP-EURUSD-USDCAD-EURCAD-30min-30min.png
    679.5 KB · Views: 124
I attach the VRM predictions for tomorrow for 5th June for GBPUSD, EURGBP, EURUSD, USDCAD & EURCAD.

Coloured levels are the important VRM levels. Watch out for the top, middle and bottom of the short term trend channel (blue) colliding with the top, middle or bottom of the long term trend channel (green).

I also attach VRM charts for AUDUSD, USDNZD and AUDNZD for 5th June. Study the VRM levels of each FX pair of the triplet to make your final trading decsion. I do not chart these FX pairs so will not present the results tomorrow.

==================== AUDUSD, USDNZD & AUDNZD LAST THREE CHARTS =======================
 

Attachments

  • gbpusd.PNG
    gbpusd.PNG
    62.7 KB · Views: 143
  • eurgbp.PNG
    eurgbp.PNG
    62 KB · Views: 138
  • eurusd.PNG
    eurusd.PNG
    61.4 KB · Views: 131
  • usdcad.PNG
    usdcad.PNG
    61.1 KB · Views: 122
  • eurcad.PNG
    eurcad.PNG
    61 KB · Views: 113
  • audusd.PNG
    audusd.PNG
    60.2 KB · Views: 146
  • usdnzd.PNG
    usdnzd.PNG
    62.3 KB · Views: 123
  • audnzd.PNG
    audnzd.PNG
    61.6 KB · Views: 127
GBPUSD, EURGBP, EURUSD, USDCAD & EURCAD ---- PREDICTIONS PROVIDED IN YESTERDAY'S POST 11:37 PM T2W LOCAL TIME

GBPUSD, EURGBP, EURUSD, USDCAD & EURCAD results for 5th June 2020 ---- US Nonfarm Payrolls


Volatility Response Model (VRM) described in the first post of this thread.

EURCAD added to complete another triplet. Now there are two triplets.

EURGBP X GBPUSD = EURUSD

EURUSD X USDCAD = EURCAD

The FX pairs follow each other about their respective VRM levels. Good for additional trading signals !

The daily VRM charts below now only display the highest , lowest and S1 sentiments levels. These are the most important sentiment levels.

3 FILES ATTACHED - ALL LEVELS IN THE ATTACHED CHARTS WERE ON LAST POST

FIRST TWO FILES

Show consecutive charts covering the full 24 hours


Weekly VRM levels in the top 30 minute charts. Daily VRM levels in the bottom 30 minte charts . Daily VRM levels only valid for the last 24 hours. Times are GMT-3. EMA channel (4,7) included. All charts show the mid-price between the bid and the offer.

THIRD FILE

Shows the 3 hour candlestick charts with EMA channel (4.7) throughout the week with weekly VRM levels for the 5 FX pairs. All charts show the mid-price between the bid and the offer.
 

Attachments

  • 2020-06-05-1106-GBPUSD-EURGBP-EURUSD-USDCAD-EURCAD-30min-30min.png
    2020-06-05-1106-GBPUSD-EURGBP-EURUSD-USDCAD-EURCAD-30min-30min.png
    321.2 KB · Views: 113
  • 2020-06-05-1800-GBPUSD-EURGBP-EURUSD-USDCAD-EURCAD-30min-30min.png
    2020-06-05-1800-GBPUSD-EURGBP-EURUSD-USDCAD-EURCAD-30min-30min.png
    343.2 KB · Views: 119
  • 2020-06-05-GBPUSD-EURGBP-EURUSD-USDCAD-EURCAD-3hr.png
    2020-06-05-GBPUSD-EURGBP-EURUSD-USDCAD-EURCAD-3hr.png
    154.3 KB · Views: 148
I attach the VRM predictions for tomorrow for 8th June for GBPUSD, EURGBP, EURUSD, USDCAD & EURCAD.

Coloured levels are the important VRM levels. Watch out for the top, middle and bottom of the short term trend channel (blue) colliding with the top, middle or bottom of the long term trend channel (green).

I also attach VRM charts for AUDUSD, USDNZD and AUDNZD for 8th June. Study the VRM levels of each FX pair of the triplet to make your final trading decsion. I do not chart these FX pairs so will not present the results tomorrow.

==================== AUDUSD, USDNZD & AUDNZD LAST THREE CHARTS =======================
 

Attachments

  • gbpusd.PNG
    gbpusd.PNG
    62.2 KB · Views: 137
  • eurgbp.PNG
    eurgbp.PNG
    61.8 KB · Views: 133
  • eurusd.PNG
    eurusd.PNG
    61.2 KB · Views: 151
  • usdcad.PNG
    usdcad.PNG
    60.9 KB · Views: 137
  • eurcad.PNG
    eurcad.PNG
    60.7 KB · Views: 124
  • audusd.PNG
    audusd.PNG
    59.2 KB · Views: 105
  • usdnzd.PNG
    usdnzd.PNG
    61.9 KB · Views: 111
  • audnzd.PNG
    audnzd.PNG
    61.5 KB · Views: 100
GBPUSD, EURGBP, EURUSD, USDCAD & EURCAD ---- PREDICTIONS PROVIDED IN YESTERDAY'S POST 1:44 PM T2W LOCAL TIME

GBPUSD, EURGBP, EURUSD, USDCAD & EURCAD results for 8th June 2020


Volatility Response Model (VRM) described in the first post of this thread.

EURCAD added to complete another triplet. Now there are two triplets.

EURGBP X GBPUSD = EURUSD

EURUSD X USDCAD = EURCAD

The FX pairs follow each other about their respective VRM levels. Good for additional trading signals !

The daily VRM charts below now only display the highest , lowest and S1 sentiments levels. These are the most important sentiment levels.

2 FILES ATTACHED - ALL LEVELS IN THE ATTACHED CHARTS WERE ON LAST POST

FIRST TWO FILES

Show consecutive charts covering the full 24 hours


Weekly VRM levels in the top 30 minute charts. Daily VRM levels in the bottom 30 minte charts . Daily VRM levels only valid for the last 24 hours. Times are GMT-3. EMA channel (4,7) included. All charts show the mid-price between the bid and the offer.
 

Attachments

  • 2020-06-08-1133-GBPUSD-EURGBP-EURUSD-USDCAD-EURCAD-30min-30min.png
    2020-06-08-1133-GBPUSD-EURGBP-EURUSD-USDCAD-EURCAD-30min-30min.png
    316.8 KB · Views: 108
  • 2020-06-08-1800-GBPUSD-EURGBP-EURUSD-USDCAD-EURCAD-30min-30min.png
    2020-06-08-1800-GBPUSD-EURGBP-EURUSD-USDCAD-EURCAD-30min-30min.png
    450 KB · Views: 100
I attach the VRM predictions for tomorrow for 9th June for GBPUSD, EURGBP, EURUSD, USDCAD & EURCAD.

Coloured levels are the important VRM levels. Watch out for the top, middle and bottom of the short term trend channel (blue) colliding with the top, middle or bottom of the long term trend channel (green).

I also attach VRM charts for AUDUSD, USDNZD and AUDNZD for 9th June. Study the VRM levels of each FX pair of the triplet to make your final trading decsion. I do not chart these FX pairs so will not present the results tomorrow.

==================== AUDUSD, USDNZD & AUDNZD LAST THREE CHARTS =======================
 

Attachments

  • gbpusd.PNG
    gbpusd.PNG
    62.6 KB · Views: 100
  • eurgbp.PNG
    eurgbp.PNG
    62.6 KB · Views: 144
  • eurusd.PNG
    eurusd.PNG
    61.3 KB · Views: 111
  • usdcad.PNG
    usdcad.PNG
    60.6 KB · Views: 102
  • eurcad.PNG
    eurcad.PNG
    60.6 KB · Views: 101
  • audusd.PNG
    audusd.PNG
    59.3 KB · Views: 99
  • usdnzd.PNG
    usdnzd.PNG
    61.8 KB · Views: 105
  • audnzd.PNG
    audnzd.PNG
    62 KB · Views: 108
GBPUSD, EURGBP, EURUSD, USDCAD & EURCAD ---- PREDICTIONS PROVIDED IN YESTERDAY'S POST 11:56 PM T2W LOCAL TIME

GBPUSD, EURGBP, EURUSD, USDCAD & EURCAD results for 9th June 2020


Volatility Response Model (VRM) described in the first post of this thread.

EURCAD added to complete another triplet. Now there are two triplets.

EURGBP X GBPUSD = EURUSD

EURUSD X USDCAD = EURCAD

The FX pairs follow each other about their respective VRM levels. Good for additional trading signals !

The daily VRM charts below now only display the highest , lowest and S1 sentiments levels. These are the most important sentiment levels.

2 FILES ATTACHED - ALL LEVELS IN THE ATTACHED CHARTS WERE ON LAST POST

FIRST TWO FILES

Show consecutive charts covering the full 24 hours


Weekly VRM levels in the top 30 minute charts. Daily VRM levels in the bottom 30 minte charts . Daily VRM levels only valid for the last 24 hours. Times are GMT-3. EMA channel (4,7) included. All charts show the mid-price between the bid and the offer.
 

Attachments

  • 2020-06-09-1143-GBPUSD-EURGBP-EURUSD-USDCAD-EURCAD-30min-30min.png
    2020-06-09-1143-GBPUSD-EURGBP-EURUSD-USDCAD-EURCAD-30min-30min.png
    315.5 KB · Views: 108
  • 2020-06-09-1800-GBPUSD-EURGBP-EURUSD-USDCAD-EURCAD-30min-30min.png
    2020-06-09-1800-GBPUSD-EURGBP-EURUSD-USDCAD-EURCAD-30min-30min.png
    383.3 KB · Views: 98
I attach the VRM predictions for tomorrow for 10th June for GBPUSD, EURGBP, EURUSD, USDCAD & EURCAD.

Coloured levels are the important VRM levels. Watch out for the top, middle and bottom of the short term trend channel (blue) colliding with the top, middle or bottom of the long term trend channel (green).

I also attach VRM charts for AUDUSD, USDNZD and AUDNZD for 10th June. Study the VRM levels of each FX pair of the triplet to make your final trading decsion. I do not chart these FX pairs so will not present the results tomorrow.

==================== AUDUSD, USDNZD & AUDNZD LAST THREE CHARTS =======================
 

Attachments

  • gbpusd.PNG
    gbpusd.PNG
    63 KB · Views: 104
  • eurgbp.PNG
    eurgbp.PNG
    62.4 KB · Views: 107
  • eurusd.PNG
    eurusd.PNG
    60.9 KB · Views: 121
  • usdcad.PNG
    usdcad.PNG
    61.5 KB · Views: 110
  • eurcad.PNG
    eurcad.PNG
    60.5 KB · Views: 123
  • audusd.PNG
    audusd.PNG
    60.1 KB · Views: 103
  • usdnzd.PNG
    usdnzd.PNG
    61.9 KB · Views: 109
  • audnzd.PNG
    audnzd.PNG
    61.9 KB · Views: 101
GBPUSD, EURGBP, EURUSD, USDCAD & EURCAD ---- PREDICTIONS PROVIDED IN YESTERDAY'S POST 10:11 PM T2W LOCAL TIME

GBPUSD, EURGBP, EURUSD, USDCAD & EURCAD results for 10th June 2020 - US FED Interest rate decision and lots of other 3 star news


Volatility Response Model (VRM) described in the first post of this thread.

EURCAD added to complete another triplet. Now there are two triplets.

EURGBP X GBPUSD = EURUSD

EURUSD X USDCAD = EURCAD

The FX pairs follow each other about their respective VRM levels. Good for additional trading signals !

The daily VRM charts below now only display the highest , lowest and S1 sentiments levels. These are the most important sentiment levels.

2 FILES ATTACHED - ALL LEVELS IN THE ATTACHED CHARTS WERE ON LAST POST

FIRST FILE

Shows chart covering the full 24 hours


Weekly VRM levels in the top 30 minute charts. Daily VRM levels in the bottom 30 minte charts . Daily VRM levels only valid for the last 24 hours. Times are GMT-3. EMA channel (4,7) included. All charts show the mid-price between the bid and the offer.

SECOND FILE

Shows chart covering the time about the US FED Interest rate decision


Weekly VRM levels in the top 10 minute charts. Daily VRM levels in the bottom 10 minute charts . Daily VRM levels only valid for the last 24 hours. Times are GMT-3. EMA channel (4,7) included. All charts show the mid-price between the bid and the offer.

On this chart you can see the low of EURUSD at its daily VRM S1 sentiment level 1.1322. I have the EURUSD daily low as 1.13216. You all had this level yesyterday. TOTALLY UTTERLY AMAZING. Traders think that they are trading individually. But as a total set of traders you are a complex system that has predictable structure. !!!!!!!!!!!!!!!!!!!!
 

Attachments

  • 2020-06-10-24hr-GBPUSD-EURGBP-EURUSD-USDCAD-EURCAD-30min-30min.png
    2020-06-10-24hr-GBPUSD-EURGBP-EURUSD-USDCAD-EURCAD-30min-30min.png
    326.6 KB · Views: 127
  • 2020-06-10-1800-GBPUSD-EURGBP-EURUSD-USDCAD-EURCAD-10min-10min.png
    2020-06-10-1800-GBPUSD-EURGBP-EURUSD-USDCAD-EURCAD-10min-10min.png
    323.8 KB · Views: 103
I attach the VRM predictions for tomorrow for 11th June for GBPUSD, EURGBP, EURUSD, USDCAD & EURCAD.

Coloured levels are the important VRM levels. Watch out for the top, middle and bottom of the short term trend channel (blue) colliding with the top, middle or bottom of the long term trend channel (green).

I also attach VRM charts for AUDUSD, USDNZD and AUDNZD for 11th June. Study the VRM levels of each FX pair of the triplet to make your final trading decsion. I do not chart these FX pairs so will not present the results tomorrow.

==================== AUDUSD, USDNZD & AUDNZD LAST THREE CHARTS =======================
 

Attachments

  • gbpusd.PNG
    gbpusd.PNG
    63.1 KB · Views: 107
  • eurgbp.PNG
    eurgbp.PNG
    62.5 KB · Views: 137
  • eurusd.PNG
    eurusd.PNG
    60.9 KB · Views: 101
  • usdcad.PNG
    usdcad.PNG
    61.6 KB · Views: 103
  • eurcad.PNG
    eurcad.PNG
    60.4 KB · Views: 113
  • audusd.PNG
    audusd.PNG
    60.1 KB · Views: 105
  • usdnzd.PNG
    usdnzd.PNG
    62 KB · Views: 126
  • audnzd.PNG
    audnzd.PNG
    61.6 KB · Views: 130
GBPUSD, EURGBP, EURUSD, USDCAD & EURCAD ---- PREDICTIONS PROVIDED IN YESTERDAY'S POST 10:26 PM T2W LOCAL TIME

GBPUSD, EURGBP, EURUSD, USDCAD & EURCAD results for 11th June 2020


Volatility Response Model (VRM) described in the first post of this thread.

EURCAD added to complete another triplet. Now there are two triplets.

EURGBP X GBPUSD = EURUSD

EURUSD X USDCAD = EURCAD

The FX pairs follow each other about their respective VRM levels. Good for additional trading signals !

The daily VRM charts below now only display the highest , lowest and S1 sentiments levels. These are the most important sentiment levels.

3 FILES ATTACHED - ALL LEVELS IN THE ATTACHED CHARTS WERE ON LAST POST

FIRST FILE

Shows chart covering the full 24 hours


Weekly VRM levels in the top 30 minute charts. Daily VRM levels in the bottom 30 minte charts . Daily VRM levels only valid for the last 24 hours. Times are GMT-3. EMA channel (4,7) included. All charts show the mid-price between the bid and the offer.

SECOND FILE

I started 5 short GBPUSD trades last night for over night. Using the charts in the second file.

Weekly VRM levels in the top 3 hour charts. Daily VRM levels in the bottom 10 minute charts . Daily VRM levels only valid for the last 24 hours. Times are GMT-3. EMA channel (4,7) included. All charts show the mid-price between the bid and the offer.

I saw on the 3 hour charts using weekly levels that GBPUSD could not break up through weekly level 1.2759. On the otherhand EURGBP had support on its weekly S1 level 0.8899. You all had these weekly levels before the markets opened last Sunday. Further last night GBPUSD could not break up through its daily S1 sentiment level at 1.2747. So I expected a GBP sell off and this happened overnight. Notice how GBPUSD and EURUSD coordinate price action at 21:00 (GMT-3) when EURUSD rallies of its daily S1 level 1.1366. This is a good exmple of GBPUSD following EURUSD.

THIRD FILE

Lists my 5 short GBPUSD trades last night that all closed 60 basis points later.
 

Attachments

  • 2020-06-11-24hr-GBPUSD-EURGBP-EURUSD-USDCAD-EURCAD-30min-30min.png
    2020-06-11-24hr-GBPUSD-EURGBP-EURUSD-USDCAD-EURCAD-30min-30min.png
    430 KB · Views: 122
  • 2020-06-11-0300-GBPUSD-EURGBP-EURUSD-3hr-10min.png
    2020-06-11-0300-GBPUSD-EURGBP-EURUSD-3hr-10min.png
    177.5 KB · Views: 141
  • 2020-06-11-GBPUSD-trades.png
    2020-06-11-GBPUSD-trades.png
    99.6 KB · Views: 117
I attach the VRM predictions for tomorrow for 12th June for GBPUSD, EURGBP, EURUSD, USDCAD & EURCAD.

Coloured levels are the important VRM levels. Watch out for the top, middle and bottom of the short term trend channel (blue) colliding with the top, middle or bottom of the long term trend channel (green).

I also attach VRM charts for AUDUSD, USDNZD and AUDNZD for 12th June. Study the VRM levels of each FX pair of the triplet to make your final trading decsion. I do not chart these FX pairs so will not present the results tomorrow.

==================== AUDUSD, USDNZD & AUDNZD LAST THREE CHARTS =======================
 

Attachments

  • gbpusd.PNG
    gbpusd.PNG
    63.2 KB · Views: 117
  • eurgbp.PNG
    eurgbp.PNG
    62.5 KB · Views: 138
  • eurusd.PNG
    eurusd.PNG
    61.7 KB · Views: 124
  • usdcad.PNG
    usdcad.PNG
    61.6 KB · Views: 116
  • eurcad.PNG
    eurcad.PNG
    60.5 KB · Views: 123
  • audusd.PNG
    audusd.PNG
    61.1 KB · Views: 132
  • usdnzd.PNG
    usdnzd.PNG
    61.9 KB · Views: 123
  • audnzd.PNG
    audnzd.PNG
    62.2 KB · Views: 143
GBPUSD, EURGBP, EURUSD, USDCAD & EURCAD ---- PREDICTIONS PROVIDED IN YESTERDAY'S POST 10:50 PM T2W LOCAL TIME

GBPUSD, EURGBP, EURUSD, USDCAD & EURCAD results for 12th June 2020


Volatility Response Model (VRM) described in the first post of this thread.

EURCAD added to complete another triplet. Now there are two triplets.

EURGBP X GBPUSD = EURUSD

EURUSD X USDCAD = EURCAD

The FX pairs follow each other about their respective VRM levels. Good for additional trading signals !

The daily VRM charts below now only display the highest , lowest and S1 sentiments levels. These are the most important sentiment levels.

3 FILES ATTACHED - ALL LEVELS IN THE ATTACHED CHARTS WERE ON LAST POST

FIRST TWO FILES

Show consecutive charts covering the full 24 hours


Weekly VRM levels in the top 30 minute charts. Daily VRM levels in the bottom 30 minute charts . Daily VRM levels only valid for the last 24 hours. Times are GMT-3. EMA channel (4,7) included. All charts show the mid-price between the bid and the offer.

THIRD FILE

Shows the 3 hour candlestick charts with EMA channel (4.7) throughout the week with weekly VRM levels for the 5 FX pairs. All charts show the mid-price between the bid and the offer.
 

Attachments

  • 2020-06-12-1022-GBPUSD-EURGBP-EURUSD-USDCAD-EURCAD-30min-30min.png
    2020-06-12-1022-GBPUSD-EURGBP-EURUSD-USDCAD-EURCAD-30min-30min.png
    322.4 KB · Views: 122
  • 2020-06-12-1800-GBPUSD-EURGBP-EURUSD-USDCAD-EURCAD-30min-30min.png
    2020-06-12-1800-GBPUSD-EURGBP-EURUSD-USDCAD-EURCAD-30min-30min.png
    329.4 KB · Views: 135
  • 2020-06-12-GBPUSD-EURGBP-EURUSD-USDCAD-EURCAD-3hr.png
    2020-06-12-GBPUSD-EURGBP-EURUSD-USDCAD-EURCAD-3hr.png
    149.1 KB · Views: 122
I attach the VRM predictions for tomorrow for 15th June for GBPUSD, EURGBP, EURUSD, USDCAD & EURCAD.

Coloured levels are the important VRM levels. Watch out for the top, middle and bottom of the short term trend channel (blue) colliding with the top, middle or bottom of the long term trend channel (green).

I also attach VRM charts for AUDUSD, USDNZD and AUDNZD for 15th June. Study the VRM levels of each FX pair of the triplet to make your final trading decsion. I do not chart these FX pairs so will not present the results tomorrow.

==================== AUDUSD, USDNZD & AUDNZD LAST THREE CHARTS =======================
 

Attachments

  • gbpusd.PNG
    gbpusd.PNG
    63.8 KB · Views: 116
  • eurgbp.PNG
    eurgbp.PNG
    62.8 KB · Views: 136
  • eurusd.PNG
    eurusd.PNG
    62 KB · Views: 119
  • usdcad.PNG
    usdcad.PNG
    61.9 KB · Views: 113
  • eurcad.PNG
    eurcad.PNG
    60.5 KB · Views: 126
  • audusd.PNG
    audusd.PNG
    61.4 KB · Views: 136
  • usdnzd.PNG
    usdnzd.PNG
    62.2 KB · Views: 128
  • audnzd.PNG
    audnzd.PNG
    61.5 KB · Views: 114
GBPUSD, EURGBP, EURUSD, USDCAD & EURCAD ---- PREDICTIONS PROVIDED IN YESTERDAY'S POST 2:15 PM T2W LOCAL TIME

GBPUSD, EURGBP, EURUSD, USDCAD & EURCAD results for 15th June 2020


Volatility Response Model (VRM) described in the first post of this thread.

EURCAD added to complete another triplet. Now there are two triplets.

EURGBP X GBPUSD = EURUSD

EURUSD X USDCAD = EURCAD

The FX pairs follow each other about their respective VRM levels. Good for additional trading signals !

The daily VRM charts below now only display the highest , lowest and S1 sentiments levels. These are the most important sentiment levels.

2 FILES ATTACHED - ALL LEVELS IN THE ATTACHED CHARTS WERE ON LAST POST

TWO FILES

Show consecutive charts covering the full 24 hours


Weekly VRM levels in the top 30 minute charts. Daily VRM levels in the bottom 30 minute charts . Daily VRM levels only valid for the last 24 hours. Times are GMT-3. EMA channel (4,7) included. All charts show the mid-price between the bid and the offer.
 

Attachments

  • 2020-06-15-0958-GBPUSD-EURGBP-EURUSD-USDCAD-EURCAD-30min-30min.png
    2020-06-15-0958-GBPUSD-EURGBP-EURUSD-USDCAD-EURCAD-30min-30min.png
    313.2 KB · Views: 124
  • 2020-06-15-1914-GBPUSD-EURGBP-EURUSD-USDCAD-EURCAD-30min-30min.png
    2020-06-15-1914-GBPUSD-EURGBP-EURUSD-USDCAD-EURCAD-30min-30min.png
    313.7 KB · Views: 112
I attach the VRM predictions for tomorrow for 16th June for GBPUSD, EURGBP, EURUSD, USDCAD & EURCAD.

Coloured levels are the important VRM levels. Watch out for the top, middle and bottom of the short term trend channel (blue) colliding with the top, middle or bottom of the long term trend channel (green).

I also attach VRM charts for AUDUSD, USDNZD and AUDNZD for 16th June. Study the VRM levels of each FX pair of the triplet to make your final trading decsion. I do not chart these FX pairs so will not present the results tomorrow.

==================== AUDUSD, USDNZD & AUDNZD LAST THREE CHARTS =======================
 

Attachments

  • gbpusd.PNG
    gbpusd.PNG
    63.8 KB · Views: 135
  • eurgbp.PNG
    eurgbp.PNG
    62.1 KB · Views: 118
  • eurusd.PNG
    eurusd.PNG
    62 KB · Views: 113
  • usdcad.PNG
    usdcad.PNG
    61.8 KB · Views: 120
  • eurcad.PNG
    eurcad.PNG
    59.9 KB · Views: 111
  • audusd.PNG
    audusd.PNG
    61.6 KB · Views: 130
  • usdnzd.PNG
    usdnzd.PNG
    62.6 KB · Views: 125
  • audnzd.PNG
    audnzd.PNG
    61.8 KB · Views: 133
GBPUSD, EURGBP, EURUSD, USDCAD & EURCAD ---- PREDICTIONS PROVIDED IN YESTERDAY'S POST 10:21 PM T2W LOCAL TIME

GBPUSD, EURGBP, EURUSD, USDCAD & EURCAD results for 16th June 2020


Volatility Response Model (VRM) described in the first post of this thread.

EURCAD added to complete another triplet. Now there are two triplets.

EURGBP X GBPUSD = EURUSD

EURUSD X USDCAD = EURCAD

The FX pairs follow each other about their respective VRM levels. Good for additional trading signals !

The daily VRM charts below now only display the highest , lowest and S1 sentiments levels. These are the most important sentiment levels.

1 FILE ATTACHED - ALL LEVELS IN THE ATTACHED CHART WERE ON LAST POST

Chart covering the last 18 hours of day


Weekly VRM levels in the top 30 minute charts. Daily VRM levels in the bottom 30 minute charts . Daily VRM levels only valid for the last 24 hours. Times are GMT-3. EMA channel (4,7) included. All charts show the mid-price between the bid and the offer.
 

Attachments

  • 2020-06-16-1800-GBPUSD-EURGBP-EURUSD-USDCAD-EURCAD-30min-30min.png
    2020-06-16-1800-GBPUSD-EURGBP-EURUSD-USDCAD-EURCAD-30min-30min.png
    312.3 KB · Views: 105
I attach the VRM predictions for tomorrow for 17th June for GBPUSD, EURGBP, EURUSD, USDCAD & EURCAD.

Coloured levels are the important VRM levels. Watch out for the top, middle and bottom of the short term trend channel (blue) colliding with the top, middle or bottom of the long term trend channel (green).

I also attach VRM charts for AUDUSD, USDNZD and AUDNZD for 17th June. Study the VRM levels of each FX pair of the triplet to make your final trading decsion. I do not chart these FX pairs so will not present the results tomorrow.

==================== AUDUSD, USDNZD & AUDNZD LAST THREE CHARTS =======================
 

Attachments

  • gbpusd.PNG
    gbpusd.PNG
    63.9 KB · Views: 110
  • eurgbp.PNG
    eurgbp.PNG
    62.7 KB · Views: 110
  • eurusd.PNG
    eurusd.PNG
    62 KB · Views: 113
  • usdcad.PNG
    usdcad.PNG
    62 KB · Views: 111
  • eurcad.PNG
    eurcad.PNG
    60.1 KB · Views: 111
  • audusd.PNG
    audusd.PNG
    61.3 KB · Views: 107
  • usdnzd.PNG
    usdnzd.PNG
    62.3 KB · Views: 116
  • audnzd.PNG
    audnzd.PNG
    61.9 KB · Views: 106
GBPUSD, EURGBP, EURUSD, USDCAD & EURCAD ---- PREDICTIONS PROVIDED IN YESTERDAY'S POST 10:14 PM T2W LOCAL TIME

GBPUSD, EURGBP, EURUSD, USDCAD & EURCAD results for 17th June 2020


Volatility Response Model (VRM) described in the first post of this thread.

EURCAD added to complete another triplet. Now there are two triplets.

EURGBP X GBPUSD = EURUSD

EURUSD X USDCAD = EURCAD

The FX pairs follow each other about their respective VRM levels. Good for additional trading signals !

The daily VRM charts below now only display the highest , lowest and S1 sentiments levels. These are the most important sentiment levels.

2 FILES ATTACHED - ALL LEVELS IN THE ATTACHED CHARTS WERE ON LAST POST

TWO FILES

Show consecutive charts covering the full 24 hours


Weekly VRM levels in the top 30 minute charts. Daily VRM levels in the bottom 30 minute charts . Daily VRM levels only valid for the last 24 hours. Times are GMT-3. EMA channel (4,7) included. All charts show the mid-price between the bid and the offer.
 

Attachments

  • 2020-06-17-1003-GBPUSD-EURGBP-EURUSD-USDCAD-EURCAD-30min-30min.png
    2020-06-17-1003-GBPUSD-EURGBP-EURUSD-USDCAD-EURCAD-30min-30min.png
    305 KB · Views: 109
  • 2020-06-17-1800-GBPUSD-EURGBP-EURUSD-USDCAD-EURCAD-30min-30min.png
    2020-06-17-1800-GBPUSD-EURGBP-EURUSD-USDCAD-EURCAD-30min-30min.png
    380.4 KB · Views: 102
I attach the VRM predictions for tomorrow for 18th June for GBPUSD, EURGBP, EURUSD, USDCAD & EURCAD.

Coloured levels are the important VRM levels. Watch out for the top, middle and bottom of the short term trend channel (blue) colliding with the top, middle or bottom of the long term trend channel (green).

I also attach VRM charts for AUDUSD, USDNZD and AUDNZD for 18th June. Study the VRM levels of each FX pair of the triplet to make your final trading decsion. I do not chart these FX pairs so will not present the results tomorrow.

==================== AUDUSD, USDNZD & AUDNZD LAST THREE CHARTS =======================
 

Attachments

  • gbpusd.PNG
    gbpusd.PNG
    63.6 KB · Views: 106
  • eurgbp.PNG
    eurgbp.PNG
    62 KB · Views: 100
  • eurusd.PNG
    eurusd.PNG
    62 KB · Views: 101
  • usdcad.PNG
    usdcad.PNG
    61.7 KB · Views: 99
  • eurcad.PNG
    eurcad.PNG
    60.4 KB · Views: 104
  • audusd.PNG
    audusd.PNG
    61.3 KB · Views: 102
  • usdnzd.PNG
    usdnzd.PNG
    62.5 KB · Views: 106
  • audnzd.PNG
    audnzd.PNG
    61.9 KB · Views: 105
Top