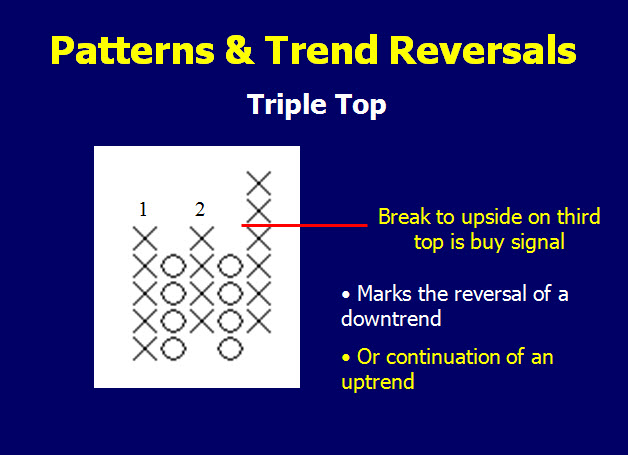
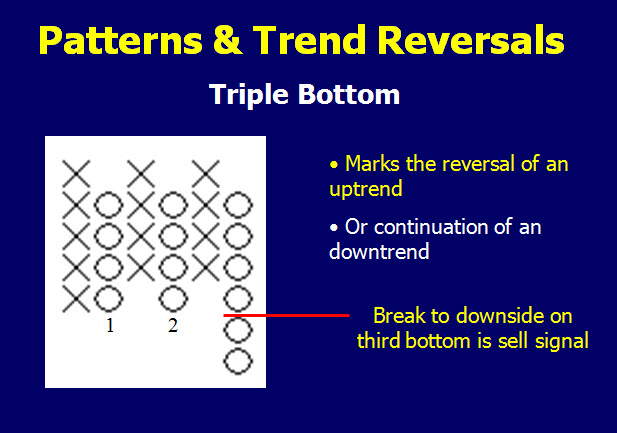
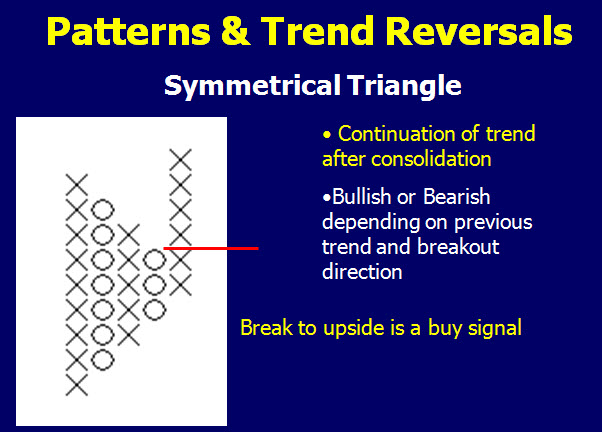
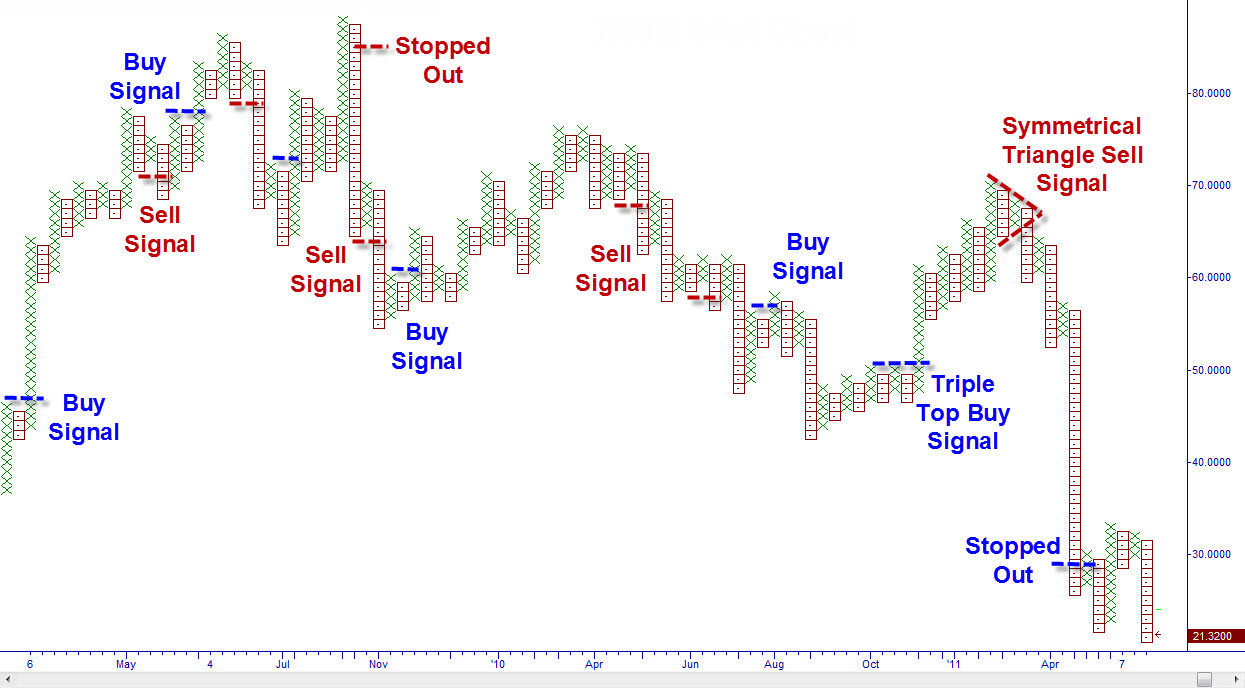
Even patterns such as triangles are visible and tradable on P&F charts. They will work in much the same manner as they would on candlestick charts.

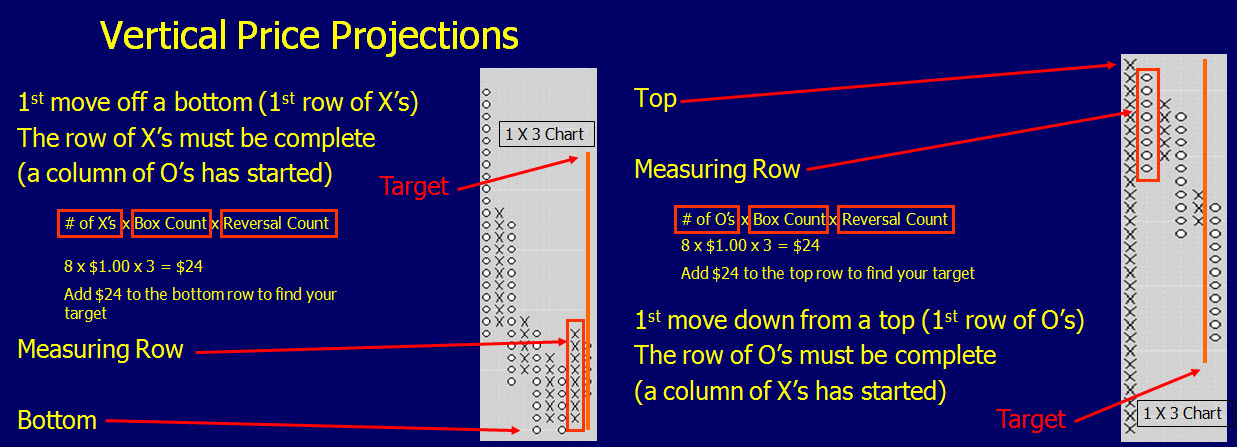
In the previous article, “That Figures,” I discussed the use of horizontal price projections. Many traders choose a different price projection method. If you are not using a 1 box reversal chart and have instead selected a three box, (this refers to how much price would have to reverse for you to start a new column; $1×3 means price would have reversed a minimum of $3), you can try the vertical price projection method. I have found this style to be more accurate in projecting targets. The vertical price projection can only be made under certain circumstances. They are:
- 1st move off a bottom (1st row of X’s)
- 1st move down from top (1st row of O’s)
- 2nd move from top or bottom
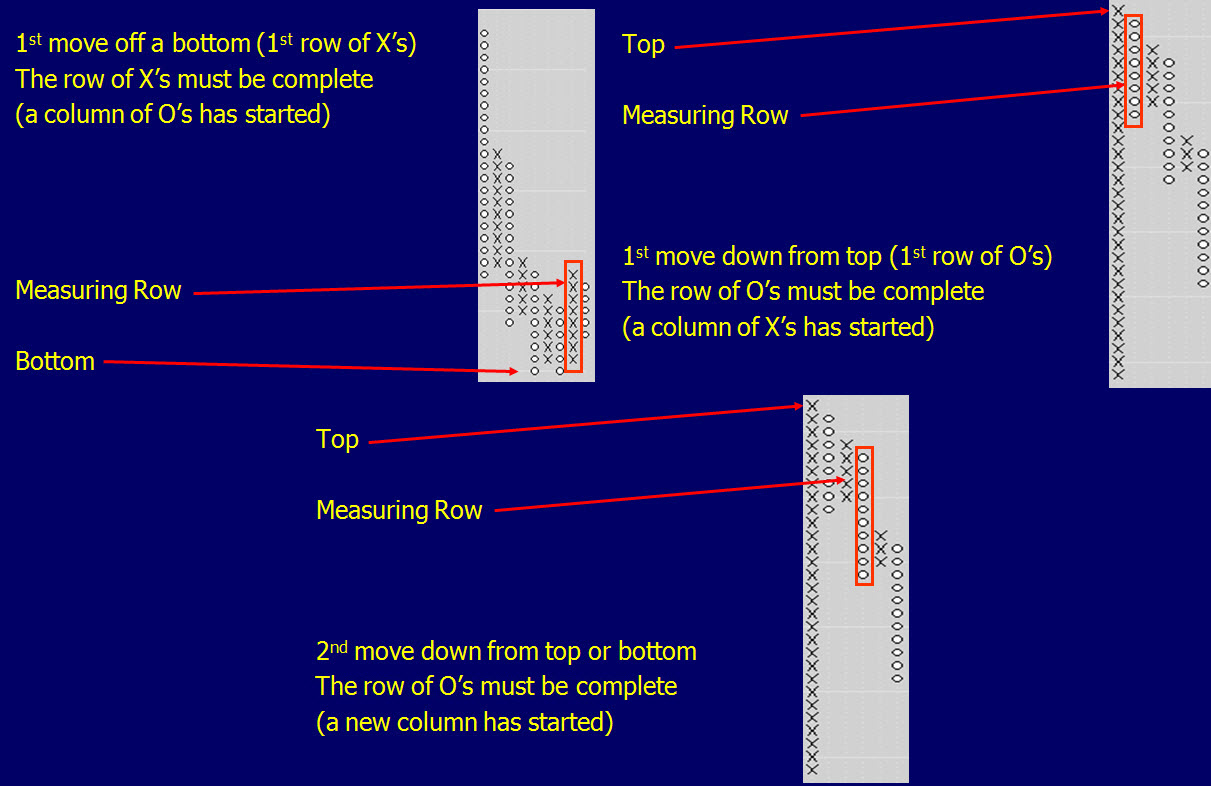
Once you have counted the correct column, you can multiply that count by the per box value and then multiply that number by the size for reversal. Your result should then be added to either the price bottom or subtracted from the price top to give you the price projection.
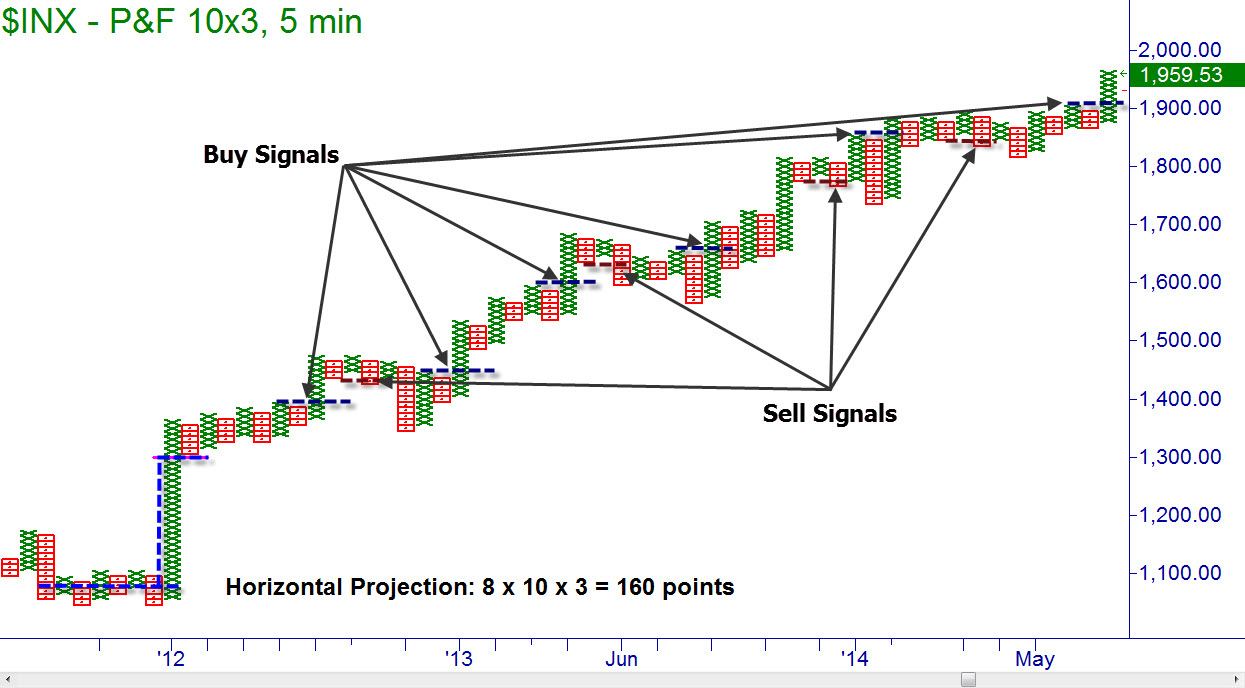
Now that we know the basics and what to look for, let’s examine a few P&F charts to see this technique in action. I have a chart of the S&P 500 in a 10×3 point and figure format. The 10 means I need a minimum of a 10 point move between closing prices to make a new box of X’s or O’s. I must also have a minimum of 30 points (10×3), to start a new column for a reversal.
I can do the same with charts of individual stocks. I have had to adjust the box size on the chart of the following stock due to its lower price.
If you are looking for smaller duration trades, you can lessen the box size and also the closing periods. I had been using the daily closes on the previous charts. In the following chart, I set the box size at $0.25 and the reversal as three. What makes this more sensitive and allows me to see intraday activity is that I set the closing prices to every five minutes. Now if the close from a five minute period would cause a change in the chart, it is noted instead of waiting for the daily close.
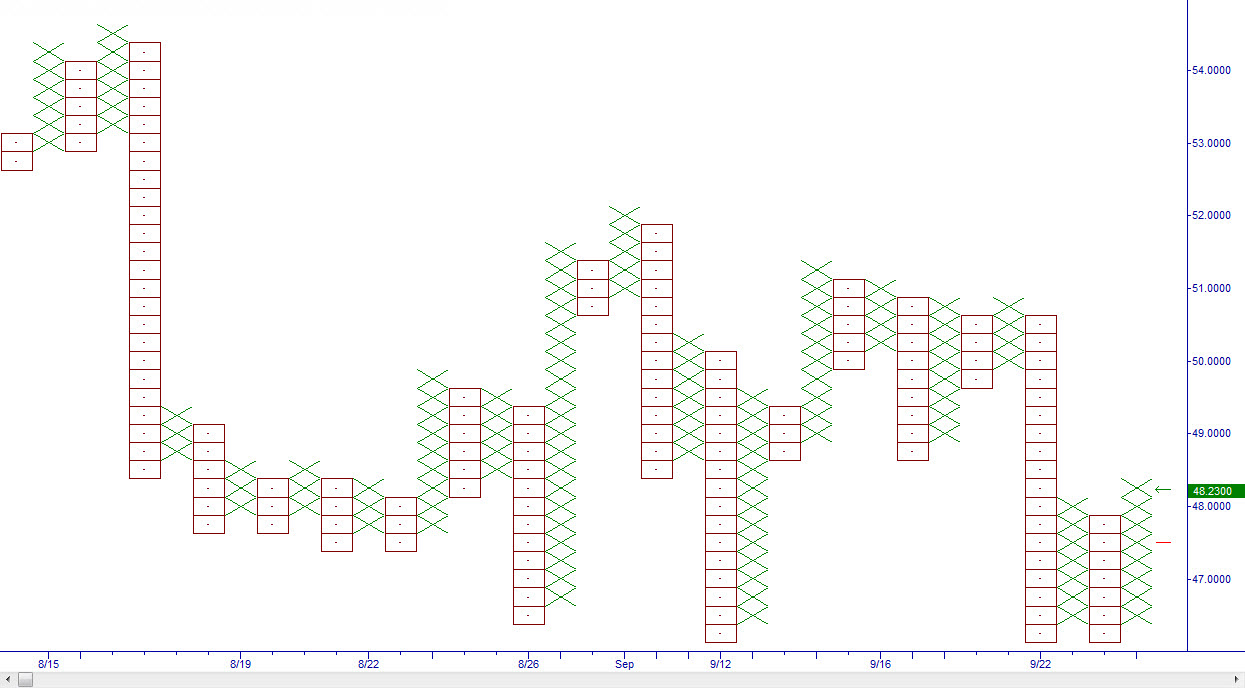
By adjusting the box size and even what closing price the box will use, you can create all types of interesting charts to follow trends in the intraday, (use $0.05 to $0.25 and close of five minutes), or even multi decade trend following charts. The possibilities are limitless.
Brandon can be contacted on this link: Brandon Wendell
Last edited by a moderator:
