Pivot points, S1, S2, R1, R2

shadowninja

Legendary member
Messages
5,524
Likes
644
Anyone trade using these? Any particular style?

Seems like almost random points but I understand these are quite powerful prices.
 
I think i've seen MT4 indicators for that type of thing. Although i've not looked at this area much.
 

Attachments

  • AutoPivotIndicator.zip
    14.3 KB · Views: 449
Last edited:
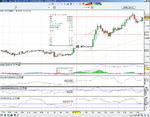
Thanks. On IG Index's graphs, it auto prints it. Example was on GBP/USD: it retraced to R1 then headed up to R2 before encountering resistance for the last 30 minutes.

Just seems a bit abstract. eg R2 = P + (yesterdays high - yesterdays low)

Why should such a price be so important in the greater scheme of things?

Can you post a chart of what you're referring to?

Db
 
Example attached.
 

Attachments

  • pivot-example.gif
    pivot-example.gif
    69.1 KB · Views: 1,496
Sorry, I don't see how your question relates to the chart you posted. Price doesn't respect any of the "pivot points" that are drawn for you, with the possible exception of 20160, but that appears to stem from what appears to be substantial support within the timeframe you've posted. Ditto with 20250, which support appears to stem from the previous swing high.

In other words, you are more likely to find useful support and resistance from previous price action than you are from the result of mathematical calculations.

Db
 
Ok, the top one did require 3 touches before it finally went through. As I was watching it, it did look like resistance. However, it does look like you're right.

Not sure how you worked out the substantial support and previous swing high (inferring my knowledge is not up to scratch rather than you being wrong).
 
IIRC one of the forex thread gurus who has since gone awol put a lot of store by these. Can't remember who it was though...

I've only looked at them briefly in the past, but like DB, couldn't really see what was supposed to be 'magic' about them, when there were more obvious and less derived points of support and resistance.
 
Ok, the top one did require 3 touches before it finally went through. As I was watching it, it did look like resistance. However, it does look like you're right.

Not sure how you worked out the substantial support and previous swing high (inferring my knowledge is not up to scratch rather than you being wrong).

If by "top one did require 3 touches" you're looking at what happened afterward, I don't know anything about that since it's not on the chart. As to whether or not the highest high on the chart you posted was resistance provided by price and volume, I'd have to see a longer-term chart, say several days, maybe more.

As to the "substantial support" and previous swing high, see below:

attachment.php


Db
 

Attachments

  • Image1.gif
    Image1.gif
    28.3 KB · Views: 3,771
Anyone trade using these? Any particular style?

Seems like almost random points but I understand these are quite powerful prices.
Some info on pivots here..

http://www.mypivots.com/articles/articles.aspx?artnum=35

There are many types of pivot calculations and then there is the 'where do you measure from' conundrum.

Having said that, pivots, namely dynamic pivots on price and time are very powerful tools.

Take one instrument and observe for a while(I use this term in a euphonistic way), and all these things become obvious.

Pivots and S+R give one definite targets and stops to submit with entry limit price as a bracket order and hence take away the urge to tinker.
 
Thanks. On IG Index's graphs, it auto prints it. Example was on GBP/USD: it retraced to R1 then headed up to R2 before encountering resistance for the last 30 minutes.

Just seems a bit abstract. eg R2 = P + (yesterdays high - yesterdays low)

Why should such a price be so important in the greater scheme of things?

its not,

Pivot point calculation you refer to is done on per bar basis I think with Cmc & Ig index chart software, it should be calculated off real index high low and close, there are varients, and you can use open hours range ( any time range) for your days pivot.

Just gives you idea where index is so to speak and likly trading ranges, I have found best use for them comparing Dow against FTSE for example but do not trade of pivot points alone.

You tend to find R2 & S2 (extremes of range) work best, SB firms out of hours respect pivot points and often you will find they mark up Ftse to R1 for example if Dow has a good close/ discrepancies can occur

ie Ftse marked at R1 because Dow rallies last 1/2 hour, you calculate Dows Pivots and find them only just at their next days pivot, Not open book to short Ftse just gives one a little insight.

ALERT - A Trending market does not have any S & R

Hope that helps , I use em through habit and they do work, but would agree that key levels of S & R week / day high happen to be in marked area any way and are more important.

Dont forget IG are SB firm displayed charts and price is not the real market :eek:
 
Some info on pivots here..

http://www.mypivots.com/articles/articles.aspx?artnum=35

There are many types of pivot calculations and then there is the 'where do you measure from' conundrum.

Having said that, pivots, namely dynamic pivots on price and time are very powerful tools.

Take one instrument and observe for a while(I use this term in a euphonistic way), and all these things become obvious.

Pivots and S+R give one definite targets and stops to submit with entry limit price as a bracket order and hence take away the urge to tinker.

sorry to lift your post rols,

Ye I agree, nice post :D
 
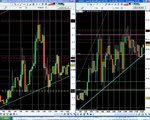
OHLC and HLC pivots seemed to have worked well on EURUSD and quite well on EURYEN today.
 

Attachments

  • EURUSD EURYEN 270907 Pivots.JPG
    EURUSD EURYEN 270907 Pivots.JPG
    240.1 KB · Views: 987
Top