Pivot point trades on US indices.

tradertim

Member
Messages
68
Likes
5
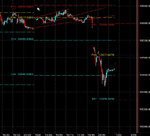
Has anyone out there traded/papertraded/backtested breakouts and/or reversals off the S1 & R1 points, as derived from pivot point calculations?

If so, please could you let us know whether this is a successful method (win/loss ratios, av. profit/av. loss) and what strategies you`ve found best for exiting trades (points target/ close at EOD/ close at S2/R2)?
 
Hi tradertim, i use the pivot points on the dow for day trading ,i find they give a fairly good indication of where the market is going to turn/ support/ resistance, and most days will find the area within a few points, i wouldn't recommend just blindly buying or selling of them but used correctly along with other tools and analysis will aid you, here is yesterdays 5 minute YM chart complete with todays lucky numbers.
Regards Mark
 

Attachments

  • dow ym 5 minute.jpg
    dow ym 5 minute.jpg
    73.5 KB · Views: 878
marky,

Thanks for your response. When you say that you utilise other tools & analysis, do you mean things like volume spikes & OB/OS signals on oscillators, or what?
 
tradertim,

The only "objective" study of floor traders pivot points I've come across is by J.T. Jackson.

I haven't read his book "Detecting High Profit Day Trades in the Futures Markets" but I did use a Jackson add on to my charting package years ago.

I think BigBusiness has highlighted this link before. But to save trawling for it, if you have a look at:

http://www.fibonaccitrader.com/journal_issue1/FTJ14.pdf

This basically gives a description of how the zones can be used as the basis of a trading plan. The zones described here are the late Robert Krausz's version of Jackson's original idea. It's basically the same idea but Krausz adds fib ratios to extend the traditional zones.

hth.
 
HI tradertim, all traders have there favourite tools they like to use, even after several years im still constantly learning new tools and techniques and most of it has come from this site, and its up to the individual to decide what works for him, there is no hard and fast rule, attached is an example of the pivots and a stochastic, something i do not use so just an example, as you can see the price has found support around the pivot area and the stochastic has turned to indicate a buy, later the price has found resistance around the pivot area and the stochastic has turned south so a sell signal has been triggered, just bare in mind you should trade the trend, but this is just an example of how you can use the pivots, and just remember nothing is 100% accurate they are just indicators and are not guaranteed to succeed,if they did we would all be wealthy, hope this has helped you out.

Regards Mark.
 

Attachments

  • 15 minute ym.jpg
    15 minute ym.jpg
    86.8 KB · Views: 687
Top