arabianights
Legendary member
- Messages
- 6,721
- Likes
- 1,380
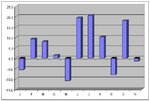
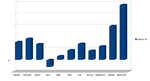
I was just wondering if pictorial journals would work... I've been analysing my trading year to date and came up with the following - gross (i.e. before commision) monthly P/L:
The actual figures don't matter, they could be £1 a line or £1 000 000 a line which is why I've removed them. I'm just interested to see if others' charts look similar (in the sense of uneven distribution, not in dipping in April and doing well last couple of months). I'm a reasonably aggressive (yet cowardly) event driven trader
Next year I intend to track my trades more thoroughly and see if returns follow a power law distribution...
Attachments
Last edited: