Orange Juice

PeterTT

Member
Messages
87
Likes
1
Always wanted to trade Orange Juice futures since seeing Trading Places with Eddie Murphy !

Looks like a good risk/reward opportunity with this contract .. Major key-day reversal (contract reached new all time low yesterday but closed above previous days range) I am buying with a stop below the previous low .. looking for a run up to 70 maybe?

Peter
 

Attachments

  • ojk4.gif
    ojk4.gif
    17.4 KB · Views: 767
Spot on Oatman

Fear of early March frost apparently makes this contract do well during 1st half of March!! If you had bought OJ K on 3rd trading of march and sold on 11th, you would have made 12 out 15 times a good return. Stopped out only 3times and made a total of 41 pts.
In my books ccertainly worth looking at.

Longer term I would agree that downtrend may yet take a bit more time before its reversed.

PeterTT, watch out those scums in OJ pit; they'll take any vulnerable stop out. I guess the only way to make money in the horrific bear market of past few years. All thanks to Mr Atkins!! 32mio americans are on low carb diets and that doesn't include OJ. In stead they are/were hooked on beef (LC)
 
I once heard a veteren commodities trader say :

"I've never traded Orange Juice and I never will."

Apparently his mother taught him to trade, and said that if he ever was tempted to trade OJ, he should go take a lie down and think again!

Can't recall his name.

I wonder why he was warned off this market?
 
Apparently a lot of com traders think it very volatile. and prefer to trade other things.
 
Seems like it's happening again. Any news out on OJ? Good weather in Florida? OJK4 down to 6220, probably taking out most vulnerable stops. On course to new lows or correction of initial advance from bottom.

If the low holds, I will turn bullish!
 
I know a few people who have been scaling into this for some time now waiting for the reversal. I agree that it looks a good bet. Think March is a little late for frost. Florida season is over by Feb, real frost scare is Dec/Jan time. Now eyes turn to Brazil crop that will be around June/July.
What does the forward structure look like? If flat then even better I would think.
 
fwd structure is still quite/very steep, does not seem to have signs of any reversal:
K 6265 -125
N 6500 -140
U 6915 +40 up on the day?
X 7035 -65
 
Hmmm. Going long in a downtrend!?

You state the key reversal day as a reason to go long. The previous key reversals didn't seem to do much.

Some valid points made about the fundamentals - but this (imo) is hope, not fact. If trading seasonals, wouldn't a spread be a possible option?

Whats volume & OI looking like?

Why not wait for further confirmation?

Good luck.
 
Thing is with buying into downtrend, you may get caught for a while so best if fairly flat or you pay up the contango on rolls. However it is certainly pretty cheap and with the weak dollar would have thought worth a punt. Brazil seem to be getting their act together these days so are not as keen to export everything as fast as possible to get dollars. Maybe they figured out that soon all the dollar will be good for is wiping their backsides.
 
The longer-term charts should always be your first 'port of call' when considering if a market like OJ is about to bottom, IMO.

A trader should never be fooled into thinking prices cannot go any lower, merely because they are at multi-year lows.

Also, as prices tend to move in proportion (most of the time), wouldn't a multi-week basing phase be probable after such a sustained downtrend? Markets take time to re-adjust.

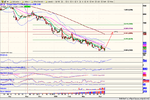
Do some creative Technical Analysis on monthly, weekly and daily charts.

Look at the bigger fundamental picture - If you follow USDA supply/demand tables, production in Florida is forecast to be equal to last year's record crop. Brazil seems plentiful also. (Problems there could arise, however.)

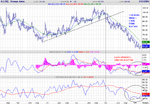
On my Weekly OJ chart attached, I've overlaid 13-week and 26-week moving averages. The 13-week MA clearly defines the overall trend and acts as dynamic resitance (OR SUPPORT FOR THE DOWNTREND)

I've also incuded MACD (8,17,19) which does show bullish divergence and a crossover.

Finally, a VERY SLOW STOCHASTIC (4,21,42) gives confirmation of the bullish divergence, but NOTE that %D (RED) has not been decisively crossed (to the UPSIDE) since the downtrend began in early 2003.

In short (no pun intended) there is not enough evidence to suggest a new trend as yet. The bullish momentum divergence could be the first sign, but until the long-term MA's are breached, that might just signal another temporary correction upwards.

All IMHO.

See weekly OJ chart attatched.
 

Attachments

  • oj weekly2.png
    oj weekly2.png
    48.2 KB · Views: 399
Dave,
As usual your analysis is thorough and much appreciated. Adding weekly RSI, it shows that this indicator has not been above 50 since Feb 03 and mspent most time between 30-45.

May I ask why you use as indicators MACD (8,17,19) and STOCHASTIC (4,21,42)? Why these variables and not the more standard 12,26,9 and 14, 1, 3?

Thanks
 
Thanks Bgold for your comments.

I use MACD (8,17,19) when looking for buy/sell signals ; it makes the OSC (MAs) more sensitive , but smooths out the EMA trigger line.

Standard (12,25,9) I find better for sell signals only.

This distinction was suggested to me by a trading veteran, but empirical observation verified the method to me.

In the Slow Stochastic, I used 21 and 42-wk smoothing to get a broader picture of Momentum and it's Moving Average.
As the chart is a 4-year weekly chart I needed parameters that would not be too sensitive, (ie crossing back & forth) but rather clearly show where major trends began and ended.

Notice the prevelance of Fibonacci numbers throghout my analysis, and a multiple. -

- 13wk MA X 2 = 26wk MA
- 21 %D STOCH X 2 = 42 %D

I find using the indicators creatively with different, (but logically derived) parameters can often illustrate a market's technical condition better than always using the default values.

It's also very intersting to tinker with these things!
 
Too many indicators for me. Sometimes if you use so many different criteria you never pull the trigger. My strategy here would be buying x lots for every 5 decline. Assume it can go to half of todays price and account for rolling it through the next 3 contracts when calculating how much margin you could tie up. Now sell OTM puts at each price where you would buy such that you take premium at the levels you intend to get long (This is hard as not often any decent quotes about, but worth offering). Once you have bought at any given level then place sell order 10 higher.
Has worked well in last 2 years on Silver, Copper,Coffee (although sweated that one), Sugar, Soy, Corn.
Not advocating anybody do this as it can be stressful at times and working out buy and sell intervals is important when considering margin tied up. Anybody with TS can easilly test out this idea to see it validity. I think it is the best way to trade "undervalued" commodities.
Only thing that worries me with the OJ is the contango. I will look at it over the next couple of days and see how the spreads look historically.
Well, that is the end of my bollocks for the evening.
Good Trading
 
Why use stochastic & MACD - they both show the same thing - momentum. Therefore, the double divergence gives a false sense of security. What if you used different parameters? Would you still have divergence? Does this make the divergence any more or less significant? Look at the divergence in the MACD histogram on the last two lows (of the histogram). Did price move up following that divergence? In my opinion, using Bollinger Bands is a good way of verifying divergences (one low outside the bands, the other inside).

I'd still be shorting this market as it looks like a correction to me! Isn't difference of opinion a beautiful thing.
 
BBB -

Thanks for your ideas - I will look into your Bollinger Bnds method.

I agree that the divergences highlighted could signal no more than a temporary correction.( Yes, they are two ways of illustarating the same thing, but the SLOW STOCH has much greater smoothing)

My main viewpoint IS bearish (re. the weekly chart). I would certainly not be going long on the basis of my analysis.
 
Last edited:
JULY JUICE bottoming?

Has OJ bottomed?

1. yesterdays' lows failed to take out lows of 1 April, and
2. Forward structure appears to be tightening. Sep over May premium has come in from 5 down to 3.5pts. A positive sign but by no means enough to pile in.

Should OJ reverse its downtrend, my target is in 69-71.5 range. I will probably wait until I see a higher high (eg above 6370).
 

Attachments

  • jo n4.png
    jo n4.png
    200.9 KB · Views: 337
September '04 OJ futures continue to rot downtrending with no bottom in sight. This is a perfect example of letting the other guy step in to define the bottom. Its no use trying to outwit the market in a clear downtrending free fall!

For now, I like OJ freefalling. At least I can drink OJ much cheaper and enjoy it more.

www.kerryonworld.com
 
mrbuzz said:
September '04 OJ futures continue to rot downtrending with no bottom in sight. This is a perfect example of letting the other guy step in to define the bottom. Its no use trying to outwit the market in a clear downtrending free fall!

For now, I like OJ freefalling. At least I can drink OJ much cheaper and enjoy it more.

www.kerryonworld.com


All very true. Is juice getting chjeaper to consumer? Or is it just retail margins going through the roof?

Who is Kerry? Site has 21 members butr claims to be "the internet's fastest growing online publishing community". Kerry certainly is an optimist! Good stuff
 
Top