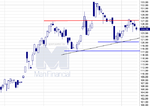
ORANGE JUICE MONTHLY CHART - 1997-2005.
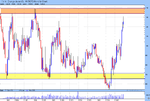
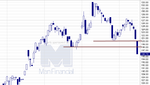
OATS MONTHLY CHART 1980-1988.
I have uncovered a striking similarity between these two monthly chart periods.
The current OJ retest of the (15-year) downtrend line is comparable to the OATS retest in early 1988.
In mid-1988 OATS spiked to record highs due to the big drought that summer in Mid-Western US.
In 2005 we have one of the deadliest hurricane seasons ever in the South/Southeast US.
Can fate lend a hand? Or is it 'all in the charts' anyway?
Or will OJ veer off and do something completely different from here?