TradeTheEasyWay
Well-known member
- Messages
- 478
- Likes
- 4
If any of you have not got screen grab software - this free one is very good for video and screen shots.
http://www.techsmith.com/jing/
Mike
http://www.techsmith.com/jing/
Mike
Well done yet again. I'm having to work hard to keep up with you Guys. So I'm steering clear of any boring UK stocks and going for gold, well beans actually.
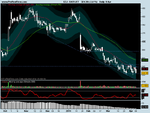
Soybeans - may contract
Closed above fib play zone
- seasonal play
- very weak US$
Entry: 13.85
Stop: 13.59
Target: 14.60
Mike Hamilton
Quick question because I would like to join, does the trade only have 5 days to work? Sometimes some of my trade ideas take a bit longer.
Nicola
Well done yet again. I'm having to work hard to keep up with you Guys. So I'm steering clear of any boring UK stocks and going for gold, well beans actually.
Soybeans - may contract
Closed above fib play zone
- seasonal play
- very weak US$
Entry: 13.85
Stop: 13.59
Target: 14.60
Mike Hamilton
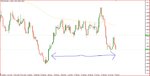
Kesa Electricals
long
Market
112.6
TP 120
SL 100
Kesa Electricals plc, through its subsidiaries, engages in retailing electrical products and related services. It sells its products in three categories: White, Brown and Grey electrical goods and related accessories. The White category products comprise various large and small sized domestic appliances, such as refrigerators, washing machines, microwaves, coffee machines, and irons. The Brown category products include various vision and audio products comprising flat screen televisions, DVD players, MP3 players, and camcorders. The Grey category products consist of telecommunications and multimedia products, including mobile telephones, personal computers, laptops, digital cameras, printers, scanners, games, and electronics. The company also offers various associated services, including home delivery, installation, and credit and extended warranties. It operates approximately 700 stores in France, the United Kingdom, Belgium, Holland, the Czech Republic, Slovakia, Italy, Switzerland, Turkey, and Spain. Kesa Electricals plc is based in London, the United Kingdom
If any of you have not got screen grab software - this free one is very good for video and screen shots.
http://www.techsmith.com/jing/
Mike
What one really needs is one of those data analysing programmes.
P/E - 10 to 15%
eps - > 5% per share price
etc.
The problem is they cost a bit and I'm not sure people actually make money using one.
Perhaps someone could comment ?
Hi Mike,
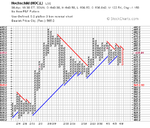
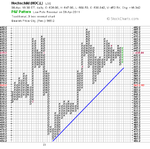
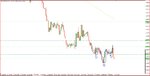
I managed to find a really good free resource that has historical futures data back to 1959 at http://pitrading.com/free_market_data.htm. So I downloaded the Soybeans continuous contract data and put it in my chart program so I could work out your initial ATR targets:
ATR Targets
Daily ATR(200) = 26.8194 (1.94%)
Weekly ATR(52) = 54.774 (3.95%)
-1x ATR: 1358.18
1x ATR: 1411.82
1.5x ATR: 1425.23
2x ATR: 1438.64
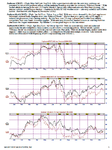
It looks like a promising pick to me, especially considering the seasonal patterns as well which I've attached a screenshot below from the Moore Research Center. It's a little out of date as you have to pay for anything newer, but the seasonal patterns wouldn't have changed too much in the last few years as it's an average of all years.
Good luck.
thanks
the interesting bit is £25 per month tho
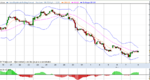
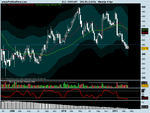
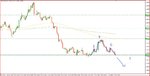
EZJ (Easyjet) - SELL
*Limit order*
Short 319
Stop 340
Target 270
EZJ has closed below key weekly 340 level for last four weeks in a row.
Price has now consolidated below on the daily and looks set for another leg down👎
Will be aboard this southbound charter from terminal 3 gate 19 when she fires up the engines:-0
cheers
Wig