You are using an out of date browser. It may not display this or other websites correctly.
You should upgrade or use an alternative browser.
You should upgrade or use an alternative browser.
isatrader
Senior member
- Messages
- 2,965
- Likes
- 136
What about risk:reward?
That might be a bit harder, as I update the stops on the spreadsheet when people move them. So I'd need to go back through the whole thread and look at the all the individual entries to work it out. If someone has the time, I'd appreciate the help.
isatrader
Senior member
- Messages
- 2,965
- Likes
- 136
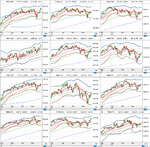
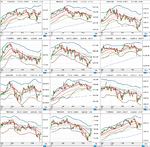
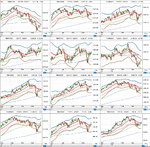
FTSE 350 Sector Charts
I've set up all the FTSE 350 sectors in my EOD chart program so I can scan it more easily for sectors outperforming before looking at particular stocks for my weekly pick. It won't be much use to the forex traders in the thread, but is interesting if you trade FTSE 350 stocks to look at all the sectors. I've used my 3x ATR Keltner channels with them as I find them very useful for dynamic support and resistance and overbought and oversold conditions.
I've set up all the FTSE 350 sectors in my EOD chart program so I can scan it more easily for sectors outperforming before looking at particular stocks for my weekly pick. It won't be much use to the forex traders in the thread, but is interesting if you trade FTSE 350 stocks to look at all the sectors. I've used my 3x ATR Keltner channels with them as I find them very useful for dynamic support and resistance and overbought and oversold conditions.
Attachments
Pat494
Legendary member
- Messages
- 14,614
- Likes
- 1,588
Just quickly scanning the major indices above its amazing how similiar they all are.
But with time short people and computers probably explains it tho
Could be a reason to look at the tiddlers which are susceptible to big money and local conditions. Egypt springs to mind.
But with time short people and computers probably explains it tho
Could be a reason to look at the tiddlers which are susceptible to big money and local conditions. Egypt springs to mind.
isatrader
Senior member
- Messages
- 2,965
- Likes
- 136
Just quickly scanning the major indices above its amazing how similiar they all are.
But with time short people and computers probably explains it tho
Could be a reason to look at the tiddlers which are susceptible to big money and local conditions. Egypt springs to mind.
I think liquidity is an important consideration when choosing. I use the S&P 500 Equal Weighted Index (^SPWY) as my main guide now, as it is evenly weighted across all 500 stocks so it gives a better representation than the S&P 500 itself which is lead by a few major stocks moves.
I think the sector charts are very important to look at for areas that are outperforming as they tend to continue to outperform for a while.
isatrader
Senior member
- Messages
- 2,965
- Likes
- 136
Ok thanks SlipC. I have the entry price as 6895.09 at 11.45am (GMT), so 12.45 (BST). Below is the updated ATR targets:
ATR Targets
-1x ATR: 6989.48
1x ATR: 6800.70
1.5x ATR: 6753.51
2x ATR: 6706.31
Let me know your new stop and target and I'll do the full trade details.
Cheers
ATR Targets
-1x ATR: 6989.48
1x ATR: 6800.70
1.5x ATR: 6753.51
2x ATR: 6706.31
Let me know your new stop and target and I'll do the full trade details.
Cheers
isatrader
Senior member
- Messages
- 2,965
- Likes
- 136
Canto1922 your limit order for ISYS.L was filled at 16:12 at 355. Below is the full trade details:
Trade Details:
Invensys (LSE:ISYS)
Direction: Long
Limit order: 355
Stop: 330
Target: 380
Percentage Risk: 7.58%
Target Gain: 7.04%
Risk Ratio: 0.93
Daily ATR(200): 9.46 (2.66%)
Weekly ATR(52): 22.75 (6.41%)
ATR Targets
-1x ATR: 345.54
1x ATR: 364.46
1.5x ATR: 369.19
2x ATR: 373.92
Good luck
Trade Details:
Invensys (LSE:ISYS)
Direction: Long
Limit order: 355
Stop: 330
Target: 380
Percentage Risk: 7.58%
Target Gain: 7.04%
Risk Ratio: 0.93
Daily ATR(200): 9.46 (2.66%)
Weekly ATR(52): 22.75 (6.41%)
ATR Targets
-1x ATR: 345.54
1x ATR: 364.46
1.5x ATR: 369.19
2x ATR: 373.92
Good luck
isatrader
Senior member
- Messages
- 2,965
- Likes
- 136
Thanks for the update Isa.
No worries. Lets hope the good move in the US tonight is carried through to tomorrow and gives our picks a bit of momentum.
isatrader
Senior member
- Messages
- 2,965
- Likes
- 136
Morning wigtrade, your Prudential short was filled at 8.03am at 717. Here's the full trade details:
Trade Details:
Prudential (LSE😛RU)
Direction: Short
Limit order: 717
Stop: 737
Target: 680
Percentage Risk: 2.79%
Target Gain: 5.44%
Risk Ratio: 1.95
Daily ATR(200): 16.68 (2.33%)
Weekly ATR(52): 41.15 (5.74%)
ATR Targets
-1x ATR: 733.68
1x ATR: 700.32
1.5x ATR: 691.98
2x ATR: 683.64
Good luck
Trade Details:
Prudential (LSE😛RU)
Direction: Short
Limit order: 717
Stop: 737
Target: 680
Percentage Risk: 2.79%
Target Gain: 5.44%
Risk Ratio: 1.95
Daily ATR(200): 16.68 (2.33%)
Weekly ATR(52): 41.15 (5.74%)
ATR Targets
-1x ATR: 733.68
1x ATR: 700.32
1.5x ATR: 691.98
2x ATR: 683.64
Good luck
isatrader
Senior member
- Messages
- 2,965
- Likes
- 136
Another incredibly badly timed trade!
This lack of patience and discipline is killing me on these big weekly trades!!
Grrrr.😡
Oh, and I'll change my stop to 7130 and target to 6750.
Are you using the same time frame to look at that you do on your intraday trades? Maybe go up a time frame or two for these longer trades.
I've updated your stop and target for you.
isatrader
Senior member
- Messages
- 2,965
- Likes
- 136
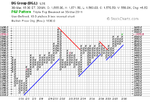
BG.L just made a triple top breakout signal on the intraday 30 minute P&F chart so I'm moving my stop up to take some risk off to below the uptrend line.
Stop to 1509
Attached is the chart
So new Risk Ratio is: 2.78
Risk now: 0.99% ATR Adjusted
Stop to 1509
Attached is the chart
So new Risk Ratio is: 2.78
Risk now: 0.99% ATR Adjusted
Attachments
Last edited:
isatrader
Senior member
- Messages
- 2,965
- Likes
- 136
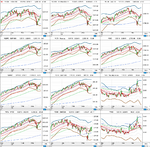
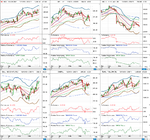
I've been thinking of ways to help myself scan the FTSE 350 stocks each week for my weekly pick for this thread, so I have made with a relative performance chart that shows 6 stocks in the same sector at a glance with their peformance, their relative performance vs the sector they are in and finally their relative performance vs the S&P 500 equal weighted index, all of which I think are useful for these short term picks as I want a stock with good relative strength in all areas that's just starting to make a fresh move.
So I've started with my pick this week which is BG.L to see how it compares to some of the other stocks in the oil and gas sector. At a glance it looks like it's the strongest of these lot, although SMDR.L looks interesting and made a pin bar close above the moving averages today. SIA.L is also showing promising signs IMO, but needs to make a good break above the 200 day moving average as looks due for some consolidation.
It is going to take ages to do this for all the sectors, but I think it will be worth it in the end.
Attachments
Last edited:
Similar threads
- Replies
- 3
- Views
- 3K
- Replies
- 44
- Views
- 14K
- Replies
- 3
- Views
- 2K