On Balance Volume

stoploss please

Established member
Messages
780
Likes
10
Hi

Are there any threads on On Balance Volume and do any of you Traders use it. If soI would love to hear about your experiences.
 
Andy,

Good to see you back. Re: OBV... I haven't seen anybody on here using or discussing it. You interested in OBV in relation to futures, or just generally. FWIW, I think you'd be better off just looking at volume. The e-signal EFS2 standard library has a new custom volume study (not an indicator) that gives you views of volume across multiple timeframes. Might be worth you taking look at that if you haven't already.
 
Hi Sand,

How's it going m8.

Not posted for ages on these boards. Been a bit busy.

With respect to OBV, I have been experimenting with it for a few months. Very simply, I use it as a trend following tool.

In the indicator I look for HH/HL in the up trend and LH/LL in a down trend.

If the next move indicator loses momentum, I use it as heads up.

It probably sounds a bit simplistic but why complicate things.
 

Attachments

  • ES 10min3.png
    ES 10min3.png
    74.3 KB · Views: 911
  • ES 10min4.png
    ES 10min4.png
    69.6 KB · Views: 1,291
The e-signal EFS2 standard library has a new custom volume study (not an indicator) that gives you views of volume across multiple timeframes. Might be worth you taking look at that if you haven't already.

Sandpiper, is that part of Advamce GET. Looking for it.
 
Andy,

No (not part of Advanced GET). Just under Formulas/EFS2/Custom/customVolume.efs. You also get the same multiple time frame capability for studies such as OBV. In other words, you could have a 10 minute OBV on a 1 minute chart.

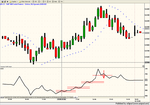
Simplistic.. well, even if it was (and fwiw, I don't think it necessarily is) it doesn't matter as long as it suits you. In its favour, it would seem to highlight the majority of lower volume pull backs during trends and would also seem to highlight certain divergences.

Practically speaking, if it does have a problem, it's that it is based on a fixed time frame or fixed time slots. Since a difference of two ticks on ES (i.e, the difference between a bar closing up or down) will completely reverse the OBV reading, I would imagine the time frame in which you viewed it would become critical.

You are obviously comfortable with 10 minute bars and the information that you get from that. I find 10 minutes a strange time frame for all sorts of reasons, but I know Skim used to use it and again, it's what suits you that matters.
 
Last edited:
Hi Sand

I base entries off the 5min chart but I use multiple time frames.

1 and 5 min
2 and 10 min
60 min, Daily, Weekly, Monthly

I apply different techniques and analysis to each time frame. It sounds complicated but as my criteria for each time frame is fairly specific, I manage to find what I am looking for without too much analysis.

I only trade intra day.

Maybe simplistic is the wrong word to use for the way I manage data from OBV. I suppose
what I meant to say is I use it in a specific way. If it is not working it is because the market conditions at that time do not suit it.

Going back to our discussions with China with respect to Skims Darkside Analysis, (brings back memories), the use of volume in a 5 and 10 min time frame was the set up. Although I use Dark Side techniques, I find that although OBV adds another layer of analysis, the way that it highlights Trend and Volume being in gear, Volume Divergences actually helps me interprit volume bars with more confidence.

I hope this makes sense.
 
Andy,

Makes perfect sense. At some point you'll have to make the leap of faith though and just use price and volume ;)

Anyway, I don't want to clutter your OBV thread, so I'll leave you to it.
 
OBV was developed by Joe Granville in 1962, a decade and a half before PC's. It served it's purpose in it's day, but assigning ALL volume to one direction or the other is crude at best. As such, it would only be useful toward long duration moves.

You might be better served by running a CUMULATIVE total of the following formula:


((close - open) / (high - low)) x volume
 
OBV alternative

OBV was developed by Joe Granville in 1962, a decade and a half before PC's. It served it's purpose in it's day, but assigning ALL volume to one direction or the other is crude at best. As such, it would only be useful toward long duration moves.

You might be better served by running a CUMULATIVE total of the following formula:

((close - open) / (high - low)) x volume

Hi Efficiency,

I was intrigued by your alternative to OBV, which I find isnt that good. Where a stock opens, then closes seems much more relevant than assigning volume just based on where it closes vs the previous close. I have a simple example if you could confirm:

prev close $20.00
open $20.50
high $20.60
low $20.10
close $20.20
volume 360,000

OBV would assign + 360,000 to its OBV line with a higher close
Would your alternative assign a -216,000 or +216,000 value to its cumulative line?

The stock closed below its open but above the previous close.
C-O = 20.20-20.50= -.30
H-L = 20.60-20.10 = .50
-.30/.50 = .6
Volume = 360000 * -.6 = -216,000

This would appear to be bearish and distribution with it closing below the open,and in the lower end of the range, hence it gets assigned the negative number. OBV was a big positive number.

Thanks for any consideration!

Jasper89
 
Top