Volume at bid & ask

rog1111

Established member
Messages
680
Likes
11
Hi all

I was wondering whether anyone here has done any serious study of bid & ask volumes ? I have been using price & volume only for quite a long time, but have often wondered whether the BA volume will reveal anything more useful than can be gleaned from the volume bar alone.

Over the past few years I have read various negative comments on this topic eg.

"Bid & ask volumes are useless because so many transactions are in between the bid & ask spread " (DON'T AGREE)

"BA volumes just add another degree of complexity which overloaded price & volume traders can do without" (MAYBE)

"For every buyer there is a seller and all transactions are created equal so what's the point ?" (DON'T AGREE)

"Times & Sales reveals all anyway" (AGREE, BUT I CAN'T COUNT THAT FAST !)

If anyone has had any actual trading experiences to relate using the BA volume in some way then I would be very interested to hear them. Or anything else around this subject.

In the interim I have constructed a small Excel app to do the work, planning to study EUR :USD futures, and I will report back with some record sheets if anyone shows an interest.

rog1111
 
i can't sya I have paid much attention to bid/ask volume but have seen commentary by proffessional traders who are into this. I believe on such example may be on these threads somewhere. The one in question was an interview with a young woman who trades for a brokerage firm, or something of that nature. Anyway to cut a long story short, in the interview she refers to seeing one of the MM's at the ask when he was at the bid all morning and talks about preferencing her order to him to see if he is really selling or not. This is one example, have heard and read many more along similar veins of the shennanigans on the L2 screens
My point being is that there are so many games played, false bids/asks, hidden orders etc that the only real proof of intent is T&S.
 
Roguetrader, interesting to hear you speak of "proof of intent" from T&S. You've also mentioned that the "market often tips its hand in advance of a move" on another thread. I spy a familiar theme here, perhaps?

I would be very grateful if you could expand on this in any way at all. Of course, I appreciate that there is probably little to be learned without watching T&S etc. in real time (for a long time), but any pointers as to what to look for would be excellent. It is an area in which I am becoming increasingly interested - essentially I want to ascertain what the big boys are up to by following their movements on T&S. I usually fail: one day a stop run, another a breakdown, for instance - but the preamble looks identical to my untrained eye. Trying to distinguish between the two by watching T&S is one of my, probably impossible, goals; that said I have every indication that it is possible to do this with experience - one just has to look, see, accept then act :)

Good choice of thread rog :)

Sorry to take it off topic a touch, but I hope we all wish to understand "intent" in one way or t'other.
 
Thanks for the replies

What I'm trying to do with this is to produce an intuitive at-a-glance display of time & sales, a quick summary if you like. As a next stage I plan to create a modified bar chart where the volume bar is made up of green (>=ask) and red (<=bid) in appropriate portions, instead of just one homogenous bar. Obviously there will be a bit of volume in between bid & ask, maybe that can be a blue bit on top. I did once see something like this commercially available, seems to have been removed from circulation ?

rog1111
 
Rog 1111 come back to me on this one because the track you are about to follow has already been trodden ~ save you a lot of work !
 
You cannot rollerskate before you learn to stand up.

frugi said:
Roguetrader, interesting to hear you speak of "proof of intent" from T&S. You've also mentioned that the "market often tips its hand in advance of a move" on another thread. I spy a familiar theme here, perhaps?

I would be very grateful if you could expand on this in any way at all. Of course, I appreciate that there is probably little to be learned without watching T&S etc. in real time (for a long time), but any pointers as to what to look for would be excellent. It is an area in which I am becoming increasingly interested - essentially I want to ascertain what the big boys are up to by following their movements on T&S. I usually fail: one day a stop run, another a breakdown, for instance - but the preamble looks identical to my untrained eye. Trying to distinguish between the two by watching T&S is one of my, probably impossible, goals; that said I have every indication that it is possible to do this with experience - one just has to look, see, accept then act :)

Good choice of thread rog :)
(sorry to take it ooff topic a touch, but I hope we all wish to understand "intent" in one way or another (QUOTE)


#######################################################################


Frugi, you are quite right in your comment. The difficulty for most ordinary people is to develop the ability to complex multitask, at lighning speed watching different things all at the same time, in harmony, in a supercooled mental state, and to separately evaluate what is relevant and what is not.

This is because in the same way that a trader (and even only at an acceptable mechanical level of proficiency) can see in a chart what he wants to see, so it is with everything else.

Additionally fast numbers have a mesmerising effect that has to be countermanded, neutralised.

And in addition, independent and separate to all this,a reserve has to be held in order to respond instantanteously to recognise, accept, and act upon a window of opportunity, instantaneously, in a nanosecond of time.

The elusive matter of intent as you call it, is a different excercise to the above, but at the highest level of understanding, a heightened awareness and ultimately self mastery of the highest order, is an extension of it. Therefore intent cannot be mastered whether by tuning into it or other means before everything else that precedes it , is mastered.

There is no such reality as proof of intent as such. This is because the intentee cannot be questioned about his intent. Intent is or is not, develops or does not, materialises or does not. But I will concede that there is a point in NFT at which intent is so manifest and you could say so advanced in its existence in intangible reality that no alternative exists for anything else but the forseen to happen, actually happen.

In NPT this unravelling of intent is what delivers frequently the opposite to what may be expected if the observer has fallen into the trap of seeing what he wants to see. This is an information shock for which most are unprepared.

This result cannot be allowed to take on the vestige of an affront, in any event. The ability to react to it immediately is the consequence of long experience and well honed response skills.

That is why I repeatedly insist also for anyone except the most experienced and responsive the use of protective stop loss precautions placed in advance of the event is crucial.


#######################################################################
 
Last edited:
Thanks Socrates, please see my PM

rog1111

SOCRATES said:
Rog 1111 come back to me on this one because the track you are about to follow has already been trodden ~ save you a lot of work !
 
roguetrader said:
My point being is that there are so many games played, false bids/asks, hidden orders etc that the only real proof of intent is T&S.

Agreed
 
rog1111 said:
"For every buyer there is a seller and all transactions are created equal so what's the point ?" (DON'T AGREE)
While it is true that for every buyer there is a seller it is very useful to know where the transacting are taking place at. When bigger size is hitting the ASK and hitting more frequently than the BID then this senario indicates more buying pressure thus a rise in price. Usually within the next few seconds or minutes for daytrading purposes.

Analysis of BID/ASK size is important and useful for indicating (very near term) future price movement especially in NSYE and Amex as you have one specialist and he is supposed to show the best "inside" BID/ASK. Of course, there are ways to probally manipulate that to some extent. The Bid/Ask size is not so trustworthy on the Nasdaq as you have several MM making the market and they play all kind of games on the Bid/ask. In addition, on the Nasdaq they are allowed to pay "through" the Bid/Ask. All of this makes Nasdaq less trustworthy in terms of analizing size and price from a bid/ask perspective.

The one thing no one can hide is the Time of Sales. So, if you see larger BID size than ASK size and the transactions are going across mostly on the ASK (thus adding volume to ask side) you can look for prices to most likely rise as this greater ask volume combined with greater ask size indicates greater demand.

So yes, a study of bid/ask volume is indicative of future price and very useful especially when you correlate it with bid/ask size.

I use a live streamer when trading stocks that indicates to me color coded if the price hit the bid or the ask and the size it was. With a glance I can see where the transactions are taking place at and their size. When I see large blocks hitting ask and bid size is larger than ask size I know I am looking at a short-term price increase ( say within next few seconds to 15 minutes).

What would be good if someone would make bid/ask volume indicator. Have 3 bars. A green one, a red one, a white one. These bars would be a live "real time" tally of the ask volume, bid volume, and the white would be the in between volume. They could be seen as visually as rising and falling depending on which side was winning. This would be a great simple indicator that would be easier than mentally trying to tally the bid transactions and the ask transaction on a time of sales screen. In one glance one could see live which had the upper hand. Bid or Ask.

PT
 
pttrader said:
What would be good if someone would make bid/ask volume indicator. Have 3 bars. A green one, a red one, a white one. These bars would be a live "real time" tally of the ask volume, bid volume, and the white would be the in between volume. They could be seen as visually as rising and falling depending on which side was winning. This would be a great simple indicator that would be easier than mentally trying to tally the bid transactions and the ask transaction on a time of sales screen. In one glance one could see live which had the upper hand. Bid or Ask.

PT
Does OBV (On Balance Volume) do some of this for you?
JO
 
JumpOff said:
Does OBV (On Balance Volume) do some of this for you?
JO
OBV doesn't do exactly what I am refering to. OBV is calculated by adding the total volume on up days and subtracting the volume on down days.

With OBV one looks for divergences between price and the OBV line. If both of them are rising then that means OBV is confirming the price and together this indicates bullish. However, if OBV is declining and price is rising then you have a bearish senario. But is OBV is rising and price declining somewhat then you have a bullish reversal likely.​
What I am talking about is a simple thermometer type indicator that tallies live bid hits and ask hits along with in between hits and correlates that with volume in each possible senario and displays that as three thermometers side by side rising and falling depending which one has the upper hand for the moment. In other words, instead of having to look at a time of sale screen and add the bid transaction and size and also the ask transactions and size and then make a judgement call on where the pressure is it seems that a simple thermometer indicator would make the task much easier. Just a glance to see who is winning. Bid, Ask or In between. By far it will be either the bid or ask most of the time.​
This could be an excellent tool for daytrading. It would have to be programmed to work off live data feed.​
I am a firm believer that volume must be correlated with price to "read the tape" and to time entries and exits. Indicators give general areas of entry and exits but the final determining factor in my books is the "tape". I use a few indicators in my trading to help me see the bigger picture, very few charts (too subjective), alot number crunching for support/resistance/pivot areas and alot of tape reading for timing.​
The thermometer indicator I mentioned above I would use in my tape reading to help time exact entry exit points.​
PT​
 
"Times & Sales reveals all anyway"

Really ?
Then how does it reveal delayed trades and iceberg orders, which are almost always the largest of trades going through.
Ans how will you distinguish a test order from a real one ?

As Livermore said, the tape is there to fool people if you know how to manipulate it (paraphrased).

Glenn
 
I haven't looked at the 2 side by side but since assumptions for each are quite different I would presume that we would get 2 quite different results. It would be an interesting comparison though.

rog1111

JumpOff said:
Does OBV (On Balance Volume) do some of this for you?
JO
 
Ah yes, there is that not so little problem too ! Not so much of a problem with Globex as far as I know, but nevertheless it's manipulation at the highest level.

Glenn said:
Then how does it reveal delayed trades and iceberg orders, which are almost always the largest of trades going through.
 
Glenn said:
"Times & Sales reveals all anyway"

Really ?
Then how does it reveal delayed trades and iceberg orders, which are almost always the largest of trades going through.
Ans how will you distinguish a test order from a real one ?

As Livermore said, the tape is there to fool people if you know how to manipulate it (paraphrased).

Glenn

Glen, as I understand it delayed orders would be a problem, but more for NYSE stocks, since the Nasdaq is mostly computerised this is much less of a problem. As for "iceberg orders" again as I understand it these are an issue for Level 2, not time and sales. The issue arises out of the fact that a MM does not have to show his entire order but can sit on the bid, or ask, showing 10 while continually refreshing his order,since time and sales show the actual order prints this is the way to identify an iceberg order. This issue is discussed in numerous books on L2.
IMHO there is nothing anyone can put up here on these boards, or any other that will work perfectly, provide you with flawlessly accurate information, that is the nature of the game.
 
Rog1111,
I have recently taken a keen interest in the volume at bid ask count and was wondering how your development of the subject has progressed.
I see the logic of counting commercial sized orders though I do agree that many smaller commercial orders would be disguised. Not that it matters?

Even so I see a great benefit in knowing in which direction the footprints are headed and more so if they agree with the overall direction of the market and price.

Can you please let me know what your conclusion was on the subject and if you have progressed with the matter.

Thanks.
 
christop said:
Rog1111,
I have recently taken a keen interest in the volume at bid ask count and was wondering how your development of the subject has progressed.
I see the logic of counting commercial sized orders though I do agree that many smaller commercial orders would be disguised. Not that it matters?

Even so I see a great benefit in knowing in which direction the footprints are headed and more so if they agree with the overall direction of the market and price.

Can you please let me know what your conclusion was on the subject and if you have progressed with the matter.

Thanks.

There is quite a lot of discussion of this over on ET. Search for threads on " market delta". You should also look at the threads on ACV.

IMHO the trades at bid/trades at ask delta is one half of the story - the demand half. The other side is the supply half, which can be read to some extent in the book.

In the stock index futures markets at least, I think the large block trades that are visible sometimes close to rollover are an irrelevancy - by definition they don't move price. To move price a trade has to be executed via the auction process and one side of the book needs to be depleted. While flipping and whatever undoubtedly do happen, they are not the dominant factor and just used as excuse by people who claim that time and sales tells the truth but you can't get anything useful from the book.

One good post over on ET suggests that the supply/demand mechanism should be viewed as four components

* Long supply : Visible as the asks in the book
* Long demand: Visible as trades at ask in T&S
* Short supply: bids in the book
* Short demand: trades at bid in T&S

I largely agree with this wrt stock index futures. So when price is rising you should be interested in the long supply/long demand pair. If you have very short period charts, and can plot the market delta, you will very frequently see the demand dry up in the delta. I have my own charting software which can show the "order book delta" - the ratio of asks to all orders in the book at all the levels. Using this I can see at a potential turning point a very large number of asks in the order flow. Putting these two things together allows us to see very large long supply (lotsa asks) and demand drying up (small volume and declining +ve delta) - at which point the upmove stalls and may reverse. I'll emphasis that you need very short period charts to see this - with IB data feed, I use 10 tick bars for the DAX.

There is a lot that can be said about this, but this I think is the fundamental mechanism. Just trades at bid/trades at ask delta is one half of the story only.
 
Volume @ traded bid ask count

dcraig1

Thank you for your reply.

Excuse my ignorance but what do the abbreviations ET, ACV and also IMHO stand for?
Also which book are you talking about? I must get a copy.

I agree in the four components as you mention in the previous mail, however would it not be most beneficial to count the commercial orders, hence orders greater than the average private trader size? And then stack them in a 5 minute, 30 minute or 1 hour bar? Hence when looking back at a bar one could see the stack of commercial sized bids taken out by the seller at a given price and vica versa for and the buyer.
I guess you know what works for you and the markets you trade, I’m just looking for something to assist my own trading method; for example if I’m looking for a short or a sell in the market it would be comforting to see the buyers drying up and sellers coming into the market at the price level that I’m considering to short at. Many would say just look at the bid and offer, however there are too many hoaxes in the market I trade.
At the same time if I was long in the market I would look for signs of the buyer to dry up and the seller to start taking a dominant hand prior to liquidating my long position.
All good in a perfect world. Not that easy unfortunately.

It would be nice to see what the commercials are doing through the bid ask traded volume in real time throughout the day.

What software are you using and what data supplier?

I use Tradestation2000i and I would like to have a closer look at the bid ask count as used by yourself. I'm just not sure how it works and I would probably need to write a code for it?

I see how it could be useful I’m just not sure if it would assist me or just add further confusion, something I'm continously trying to eliminate from my trading?

Hence I guess I’d like to have a look at it first in real time? I trade the SFE SPI and there are always plenty of hoax bids and offers and the commercials often play silly buggers in 1 and 2 lot sizes just to make it look like locals are trading however the refresh rate is just repeated 50-100 times sometimes? This is obvious in a slow market.
When the market is moving I guess they don’t have time to waste and just get on with the orders.

Thanks again, quick question does it assist you in making better trading decisions.

Christop
 
Hi christop,

A bit to cover here, but I'll have a go.

First, I use the term book as in order book to mean the depth of market (DOM).

The software I use is my own - written in Java - and uses the InteractiveBrokers feed - http://www.interactivebrokers.com
I also implemented support for http://www.opentick.com , but am only using it for historical data as yet.

IMHO: In my humble opinion.

ET: The EliteTrader message board. I won't post a link - it might be bad form on t2w.

ACV: Accumulated volume - difference between the number of contracts visible on each side of the DOM. I don't like the term much but some people use it. I prefer "order book delta".

As for the importance or otherwise of that element of market delta for which commercials or large players are responsible, I must confess that I don't have an opinion. There was some discussion of this over on ET, but no definitive answers. Both examples and counter examples were shown as I recall. Of course it sounds intuitively reasonable, but as with many things in trading, intuition and conventional wisdom is often wrong.

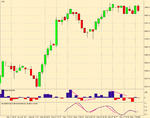
To get to the nitty gritty, attached is a chart of current DAX session. The first 30 mins or so is missing. Each bar is 400 contracts wide.

The second from top plot is the "market delta" - trades at ask minus trades at bid

The bottom plot is a smoothed representation of the number of contracts at the ask in the DOM divided by total number of contracts shown in the DOM. The range is therefore 0.0 to 1.0.

Notice how the "market moves towards size" until demand dries up ("market delta") and supply maximizes ("order book delta").
 

Attachments

  • dax_400contracts.png
    dax_400contracts.png
    15.4 KB · Views: 735
dcraig1,

Thank you for your response and clearing many items up.

Great to see the chart.
I’d like to see it in action in our markets and the response it would create?
Do you find the same sort of patterns reoccurring as you mention and then couple these with price patterns? and other analysis etc.
I would believe you would have a higher success rate of trades too because your adding another dimension to your trade analysis, well done.

I’m wondering if anyone has attempted or written an ela (Tradestation) code for such a task.
Great work dcraig1, I can see the validity of how it assists in your trading.

I notice your in Brisbane do you trade the Aussie futures markets as well?
How much is the data feed cost from IB?

I shall continue my quest in self improvement and once again thank you for your time and assistance.

I’m always on the look-out for ways to improve trading results.

Christop
 
Top