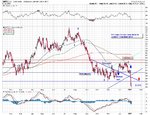
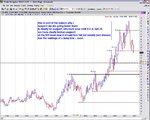
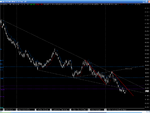
Nymex Crude upwards and onwards

Hook Shot said:
I-We've got that dead cat bounce which has exceeded $1

II- We also found support at the aforementioned $55
(54.90 actually....within cents of the Nov lows=2k6 lows)

It's now game on as my stop is in place.... come on Mr Crude I dare you to stop me out!!! :cheesy:

Trend is clearly not up but what the hell - risk is minimal (For Me)

What a lucky so and so I am - no losing trades in 2k7 (so far) everything's making (good) money right now......... it's madness :cool:

I gotta enjoy it cos it may not last ............ :LOL:

No more big calls - I don't want to push my LUCK....

Update: Thanks Frugi - I used your marker to take profits..
 
Crude chart..one more leg down then BUY???
 

Attachments

  • wtic.JPG
    wtic.JPG
    164.4 KB · Views: 275
catracho said:
Crude chart..one more leg down then BUY???

Not sure Catracho..... I'm getting less confident .... about oil - will still make money from bounces but I'm starting to think things might be changing into a bear market...

As you know I'm not one for charts and technicals too much but the noises I'm hearing ...... seem to support a tectonic shift... time will tell.

But yes......... if I'm off base about this tectonic shift thing and a Big rally in crude is in the works - then it's coming to me....and I'm ready!
 
Please indulge my urge to wear my conic analyst's hat for a minute. A lot of folk seemed to think the world would end if 55 failed yet all those allegedly "huge" stops below failed to spectacularly cascade when it was breached.

I think this recovery above 55 is temporarily bullish and am eventually looking for 57.6 then possibly 58.6 (a long way I know) IF one of these little bars can close above 56.250 where there is an inverse H&S neckline of sorts (for what it's worth - stupid unreliable technical pattern :)). This neck is also the 618 retrace of the move down from 57.7.

Today it has just "done its duty" and filled the day session gap around 56. So tomorrow should be interesting. We have inventories at 3.30 which may be a catalyst for some action. If we drop back through 54.9 I'd be looking for a double bottom around 54 or further carnage. But given the 15% drop in 12 days I reckon odds now favour a decent upwards pullback? How much more fund long liquidation can there be? Famous last words lol.

Anyway after a few scalps I've ended up long from just under 55 with a stop on one at 55.3 and t'other at 54.7 (essentially b/e) and will update position tomorrow. I will probably chicken out if we hit 56.8 first (38% retrace) and sell one as I do not usually position trade and that is also roughly where I'd expect a pullback to the neckline. Still all wishful thinking as it may collapse instead.

I must say I like the clarity and structure of volume charts on crude. They're a handy way of including the overnight session without enduring messy charts (such as one gets with time based bars).
 

Attachments

  • pozzie.JPG
    pozzie.JPG
    5.6 KB · Views: 195
  • blackgold.PNG
    blackgold.PNG
    74.3 KB · Views: 158
Last edited:
Hi Frugi ..hi hook shot..u guys dont trade spreads...WTI and Brent spreads are showing enormous ranges and volatility these days.. its true that its a bit difficult to crack the logic behind movement of these spreads but at times they are very profitable..I trade for a prop shop in ICE and there are guys working with me who make 3 to 4 thousand pounds every day just by day trading these spreads...

UR views please
 
de_cooky said:
Hi Frugi ..hi hook shot..u guys dont trade spreads...WTI and Brent spreads are showing enormous ranges and volatility these days.. its true that its a bit difficult to crack the logic behind movement of these spreads but at times they are very profitable..I trade for a prop shop in ICE and there are guys working with me who make 3 to 4 thousand pounds every day just by day trading these spreads...

UR views please
Hi de cooky........I haven't traded the spreads in past but will look at it when/if I get a quiet moment today ! You guys across there are getting the job done - I know the feeling (for the moment anyway) :LOL: :LOL:
 
Hook Shot said:
Hi de cooky........I haven't traded the spreads in past but will look at it when/if I get a quiet moment today ! You guys across there are getting the job done - I know the feeling (for the moment anyway) :LOL: :LOL:

Hook shot ..I love ur timing..u said( for the moment anyway) and I lost 2k pounds for the day...kept going short on spreads just and booked losses judt before the news of Russia and belarus broke and spreads fell like nine pins..
 
de cooky ......... all in the game. some you win and others ........ can't bring myself to say the word LLLL nope forget it.

180d and new lows - might be significant........ but then again it might wait for Friday/Monday.
This market is now backed into a corner just the way I like it. It must now keep sliding or ..... you know the rest!
 
Nymex Crude

Hi

Anyone out there, can guess what level Crude will turn positive, after this rapid drop.
Surely OPEC will cut supplies soon, any ideas ?
 
HS remember the the thread
Crude to $100 and above

im kind of leaning towards a drop around the $40 area long term
im just trying to figure out which scenario will play out
from a technical level this move down has geometric support for price but im not convinced though price has hit expectations timing is way too short
so ideally we drop to around $48 have a rest or a pop and then drop some more to the $40 area
thats my road map for now
 
Well I was wrong about that inverse H&S and was stopped out for b/e. Now placed resting limits to try and buy this wedge bottom.

1 at 53 and 2 at 52.5, stop 51, will adjust tomorrow as required if filled.

52.4 would complete a 1:1 compared to previous drop > 57.7 to 53.8 = 56.2 to 52.4
A smaller 1:1 > 56.2 to 53.9 = 54.7 to 52.4

Weekly looks ugly but I reckon the 50% at 52 should provide a decent bounce if the 38% is anything to go by?

Andy a chart from your good self with professional measurements would be most welcome. :)
 

Attachments

  • untitled.PNG
    untitled.PNG
    134.1 KB · Views: 228
  • weekly.PNG
    weekly.PNG
    55.3 KB · Views: 183
  • 1to1moreobvious.PNG
    1to1moreobvious.PNG
    49.3 KB · Views: 168
Last edited:
52.25 is also 33% of the 78.40 highs - so I'm with you on that one Frugi. Especially since $50 is a bit obvious!

Andy - sure do remember Oil to $100 seems unlikely by the week ...... but you never know what the lads have planned ? :cheesy:
 
hi all

I do agree on the 52 level as very strong support , not just because is the 50% from the summer highs , but also opec will start defending very soon t eir price , the saudis already reduced by 12% February shippements to asia , and another bullish story is Nigeria , lets not forget elections are coming in april in this country of present big political instability, plus in my humble opinion could in the us will be coming sooner the latter even with all this calls of "el Nina event " nad lets be realistic at the moment crude stocks are lower then last year by the some time ...
 
frugi said:
Well I was wrong about that inverse H&S and was stopped out for b/e. Now placed resting limits to try and buy this wedge bottom.

1 at 53 and 2 at 52.5, stop 51, will adjust tomorrow as required if filled.

52.4 would complete a 1:1 compared to previous drop > 57.7 to 53.8 = 56.2 to 52.4
A smaller 1:1 > 56.2 to 53.9 = 54.7 to 52.4

Weekly looks ugly but I reckon the 50% at 52 should provide a decent bounce if the 38% is anything to go by?

Andy a chart from your good self with professional measurements would be most welcome. :)
frugi

just eyeballing at the moment
i have various scenarios in my head once one hits me so to speak i will post a chart

HS
$100 is realistic i suspect, not for some time though
 
OIL inside a longterm downtrend

I dont get it. what is the question on this matter ?
 
I can wait...

Zen and the Art of speculation......... perhaps I should write a book whilst I'm waiting ?
 
Squirrelled the single at 53 now just using this handy Kiwi trailing stop lin (red) for exit....
 

Attachments

  • seeulaterondownthetrail.PNG
    seeulaterondownthetrail.PNG
    36.6 KB · Views: 167
here frugi a couple of charts
one of my road maps i normally keep it in my head
this is how im seeing things at this stage

these are longer term thoughts
 

Attachments

  • crude weekly.jpg
    crude weekly.jpg
    255.3 KB · Views: 220
  • crude monthly.jpg
    crude monthly.jpg
    238.1 KB · Views: 192
Thanks for those Andy. I can't fault your reasoning.

I went on the hamster wheel for an hour and missed all the fun. Previous long thankfully trailed out at 54.15 as per Kiwi line in last post. But I left my limit in at 52.5 so am now long 2 there with a stop at 51. :eek: I may regret that. If I get the chance I'll dump 1 at 53 tomorrow.

But ... this drop has taken it to the 50% level mentioned earlier on the weekly chart. Also I think I see a Wolfewave on the 512vol chart below - a clean 5 wave down pattern with the 5th breaking out below the wedge as Mr. Wolf intended. In case this pattern works I have drawn in the potential target line. Also marked at 51.5 is the 1:1 of wave 3 which is also 161.8% extension of wave 1. I think I will add one more lot if we get there, probably throwing good money after bad, but we'll see. For the indicator folk there is also a massive bullish divergence on the hourly. Today's volume was higher than last few days, over 45k, but probably not enough to count as capitulation. Still, perhaps the tide will be stemmed for a day or two? Now let me see how much more bullish evidence can I selectively gather to support my position while it plummets to 50? :D
 

Attachments

  • fib.PNG
    fib.PNG
    63.9 KB · Views: 173
  • rsi.PNG
    rsi.PNG
    49.3 KB · Views: 170
Last edited:
Top