Breakouts out of trading ranges are of the most respected price movements by technical analysts. Trend followers adore them and short term swing traders who base their decisions upon overbought-oversold situations get anxious at their appearance. Technical analysis textbooks have a special section devoted to range breakouts and almost all trading methodologies incorporate a strategy for them.
In this article I will briefly review the classic breakout strategy and discuss the Habit Force which is hidden behind the false breakouts. In the sequence I will discuss the CWTW and CounterAttack tactics.
Trading Ranges - Review and Classic Tactics
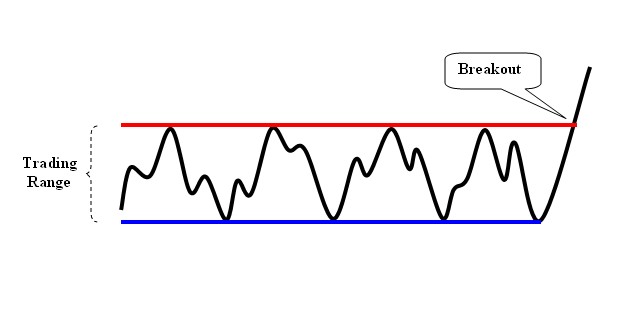
In figure 1 you may see how a classic trading range looks. As its name implies, a trading range is a strip defined by two horizontal lines (a resistance line and a support line) which encompasses the price values (black line) of a trading vehicle for a time period.
Trading ranges are considered periods of energy accumulation. When the price finally breaks the range, the accumulated energy is unleashed resulting in a significant price movement in the direction of the break. The basic strategy dealing with trading ranges is to wait until a breakout occurs and take a position in the direction of the break. There are, however, a number of short term traders who try to profit from the price oscillations inside the trading range by buying near the support and selling near the resistance. The latter tactic satisfies the hunger of swing traders for action and has a main advantage: the pronounced buy and sell levels. However, there is a debate between trend followers and short time swing traders whether the trading inside a price range gives a significant edge. Some of the usual drawbacks attributed to range trading are:
On the other hand, the traders who base their positions in range breakouts face the frustrating "false breakout" case. In a "false breakout" the price exits the trading range (sometimes accompanied by significant volume) but fails to initiate a trend in the direction of the break. In figure 2 you may see how a typical upward false breakout looks. The price (black line) exits the trading range and eggs traders to take long position with a stop loss threshold the previous resistance line of the trading range. The price then comes back to the resistance line of the trading range, stalls for a while and then reenters the trading range activating the stop loss orders.

The HF Principle
Humans are generally reluctant to change their habits and the same seems to hold for the markets too (besides, humans actually move the markets) . I will hereon refer to the tendency of the markets to maintain their "habits" using the term "Habit force" or simply HF. The HF principle states that the markets incorporate a tendency to maintain their "habits".
One of Dow's main principles about the trend continuation (a trend is active until it is terminated) is a type of HF. The tendency of the price to retrace in the vast majority of trends is also a type of HF since retracements show that the price is reluctant to the change its value and tries to come back to its previous condition.
Pullbacks and the HF Principle - A Philosophic Approach
The vast majority of the breakouts are accompanied by pullbacks. A pullback is formed when the price tries to reenter the trading range after a breakout and this is another type of HF since the price actually tries to continue its oscillating movements inside the range.
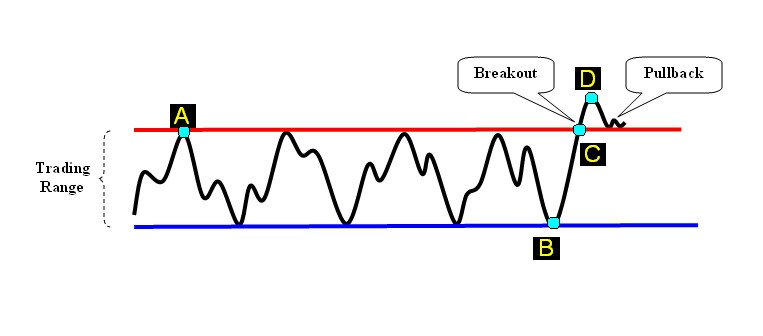
In figure 3 the case of an upward breakout accompanied by a pullback is shown. From point A to point C the price has the habit of being inside the range defined by the blue support and red resistance lines (medium term habit). From point B to point C the price is under the effect of short term up-trend (short term habit). As soon as the price reaches the resistance level two forces are applied to it. The short term force tries to pass the price above the resistance and the medium term force tries to send the price back to the support blue line. At this point, considering the old saying "The longer a habit holds, the more difficult to overcome", we would expect the medium term habit to beat the short term one. In other words, even if the price passes above the resistance (point D), the chances are it will come back inside the range rather than continuing up and this is actually true when facing a case like the one shown in figure 3.
If you wonder: "...then why do many technical analysts try to get in a stock as soon as an upward breakout occurs?" the answer is simple: If a breakout turned out to be valid and a trend is initiated in the direction of the break, this trend is usually extremely powerful. Technical analysts try to get in the trend early and gain as much profit as possible but they simultaneously take rigid precautions using tight stops which they respectfully abide by. This is clear in David Ryan's approach to breakouts which is analyzed in the next paragraph.
A Wizard's Approach
In his book Market Wizards, Interviews With Top Traders Jack D. Schwager recites David Ryan's interview. Mr. Ryan uses much of William O'Neil?s stock selection method which relies upon "buying strength" (that is, buying the best performing stocks in both technicals and fundamentals). According to Schwager, Ryan's approach to upward breakouts is to by a stock as soon as it is breaking out of a long term trading range and simultaneously place a stop loss order at the top of the trading range. As Ryan says in Schwager's book: "If the stock reenters its base, I have a rule to cut at least 50 percent of the position. Frequently, when a stock drops back into its base, it goes all the way back down to the lower end of the base".
Even if Ryan's approach is to "buy strength" (thus buying promising and healthy stocks), it is obvious that he respects the HF principle and does not rely upon the premise that an upward breakout must necessarily imply a strong bullish trend. On the other hand, a closer look in Ryan's words may lead to the CounterAttack tactic. If when a stock reenters the trading range it frequently goes all the way back down to the lower end of the range, then it may seem a good idea for short term traders to take a short position at the time the stocks reenters the range after the breakout. I will refer to the CounterAttack tactic later in this article. Mr. Ryan however does not advocate the CounterAttack tactic not only because he focuses in the longer and profitable trends but also because his rigid CANSLIM-oriented stock selection process filters out the stocks which do not meet the criteria for a strong bullish trend. Thus, short selling a strong stock would be very dangerous.
Pullback and the HF Principle - An Empirical Approach
One of the main reasons behind the preference of David Ryan (and almost all technical analysts) to upward breakouts is that after the breakout of a long trading range there is no profound resistance above the price. In other words, all who have bought inside the range are in profit and the stock is not under selling pressure. This is true in most of the cases, especially when the breakout occurs after a very long trading range (lasting several months or years) but the frequency of pullbacks after breakouts shows that actually there is a selling pressure after the breakout by all those who were "stuck" in the stock during the development of the range and finally find the opportunity to get out in a quite favorable price. Only when this selling pressure is dried up the price is capable of going higher.
The Go With the Winner (GWTW) Tactic in Upward Breakouts
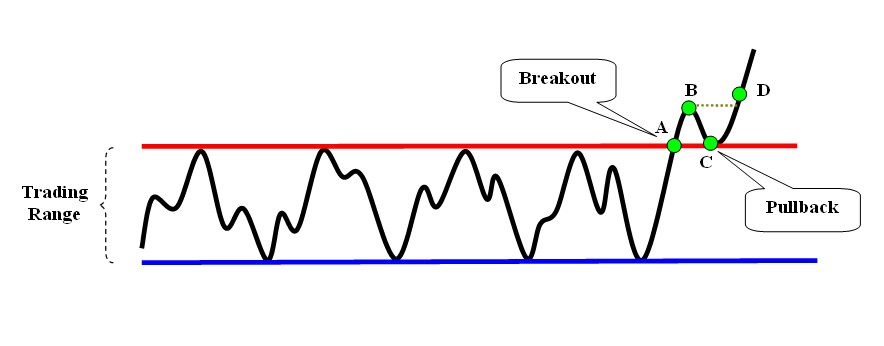
Since at pullbacks a battle of a short term habit with a longer one is taking place, a conservative approach is to wait and see who will be the winner before taking action. How could you know who won? For upward breakout cases, simply look for the price to pass the breakout bar after it has pulled back. In figure 4, the best time for taking a long position is neither at A, nor at B or C but at D. At D it is clear that the habit force which was responsible for sending the price from B back to C is not stronger than the habit force which wants the price to go up. This type of trading action (hereafter called GWTW) is of course more conservative than the one which follows the price as soon as the breakout takes place. The main advantage of GWTW is the adaptation to the market condition at the right time. In addition, if the resistance of the previous trading range (red horizontal line in figure 4) is being set as a stop loss threshold, the risk/reward ratio is considerably high for the cases where the BC segment (see figure 4) is not tall enough.
The Forewarning Signal
Are there any price signals that can forewarn of a possible breakout? The answer is yes in most cases. Many upward breakouts usually take place after a failure of the price to get quite close to the support level of the trading range. Inside a trading range, the habit of the price is (by definition) to move from the low of the trading range to the top of it. A failure of the price to reach the low of the range indicates its tendency to change this habit. In figure 5 you can see an iconic case of an upward breakout. The price oscillates inside a trading range and sequentially touches the red and blue lines which define the range. After reaching a local high point A the price declines at point B which is well above the support level (blue horizontal line) but lower than the midline of the trading range. In the sequence, the price advances sharply (point C) and then breaks the resistance level (red horizontal line). The forewarning signal is given at point C.
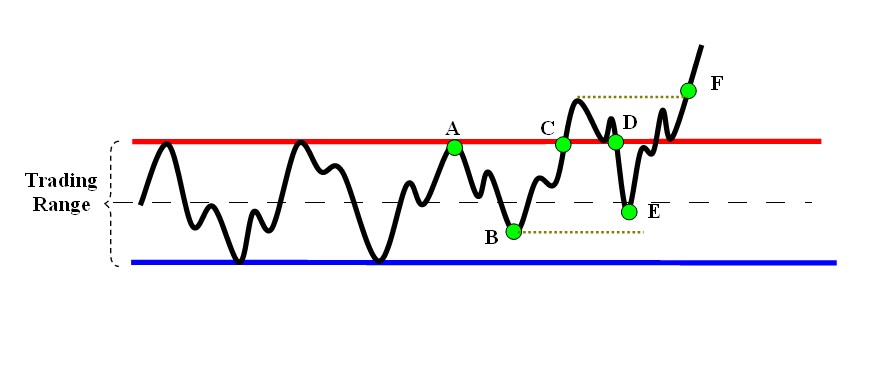
The GWTW strategy is capable of saving you form the frustrating case where the price pulls back and reenters the range (point D) thus activating the stops. Even if the price reenters the range there is still hope for a profitable long position if the price fails to reach the support level of the range (point E) and more preferably if it fails to fall below the level of point B. The buy signal is given at point F where the price overtakes the initial breakout with a stop loss threshold the high of the trading range. Note that the iconic example of figure 5 is the general case. Many times the price will not decline to point E after the breakout and it will quickly pass from point D to point F. Also, notwithstanding that in figure 5 I have presented a pullback, the forewarning signal is generally a significant indication that a pullback may not be formed and is of the cases where it may be worth taking action at the breakout especially if the breakout takes the price in all-time highs. In short, when you are considering the case of taking action at the breakout without waiting for a pullback check to see if a forewarning signal has occurred as this will increase the odds for you.
The Conterattack Tactic
Trading ranges whose support/resistance boundaries are not clearly defined are more prone to produce false breakouts since the breakout itself is difficult to define and seen. In such cases short term traders may gain profit by the CounterAttack tactic. For this tactic, the support/resistance boundaries of the range (which will be used to provide breakout signals) must be defined in such a way that the range contains the vast majority of the price and leaves outside only very brief exaggerations (spikes etc.) If the price reenters the range after an upward breakout a sell signal is activated with a stop loss threshold the highest price after the breakout and first target the middle of the trading range (and next target the low of the range).
The CounterAttack tactic can also be applied in well defined trading ranges. The rational behind this is that many technicians use the resistance of the trading range as a stop loss threshold when they take long positions at the breakout. Thus, when the price clearly reenters the range a cascading of stop loss orders are activated resulting in a price decline.
There are some things you must keep in mind concerning the CounterAttack tactic. First, the reward/risk ratio is of extreme importance. The trading range must be wide enough to compensate for the associate risk as defined by the stop loss level. Second, it would be prudent to use an appropriate filter to determine if the reentering of the price inside the range is acceptable and this is because after a breakout there are traders who await the pullback and place their buy orders at the resistance level of the range. Third, there must be no forewarning signal prior to the breakout.
Chart Examples
Though I discussed the GWTW and CounterAttack tactics for the upward breakouts they can also be applied in downward breakouts with the appropriate conversions.
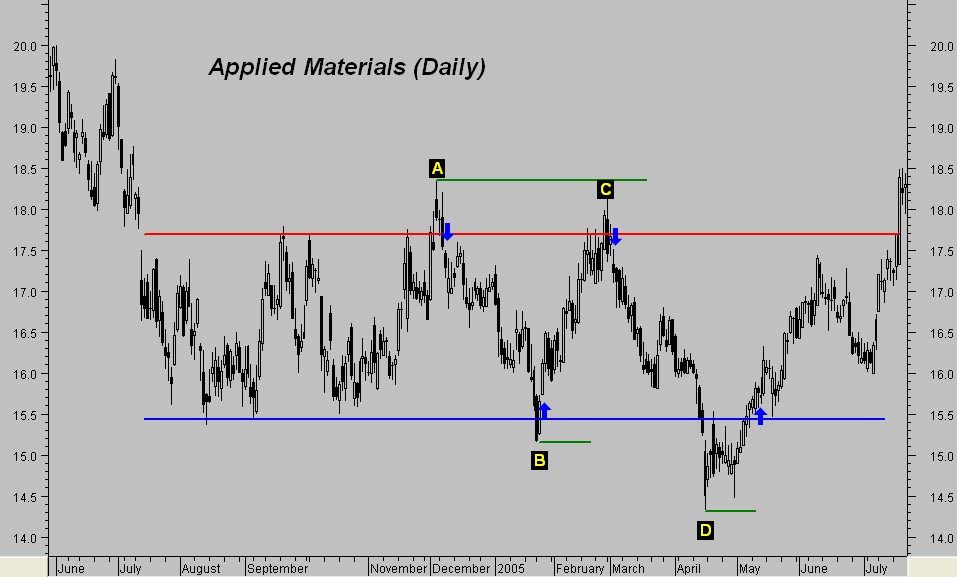
In figure 6 the daily chart of Applied Materials (NDX) is shown. The blue and red horizontal lines define a trading range. The A, B, C and D points indicate false breakouts and the blue arrows indicate possible entry points for the CounterAttack tactic. The green horizontal segments show preferable stop loss thresholds.
A similar example is shown in figure 7 this time with the daily chart of Linear Technology (NDX). CounterAttack signals (blue arrows) after points B and C are clear (the green horizontal line segments show the stop loss thresholds). A downward sell signal is shown after point A with a question mark above it to show that based only upon the information from the price chart this CounterAttack signal is extremely risky. The reason for this is the forewarning signal at A (note the price movement from point X to point A and the low at Y).

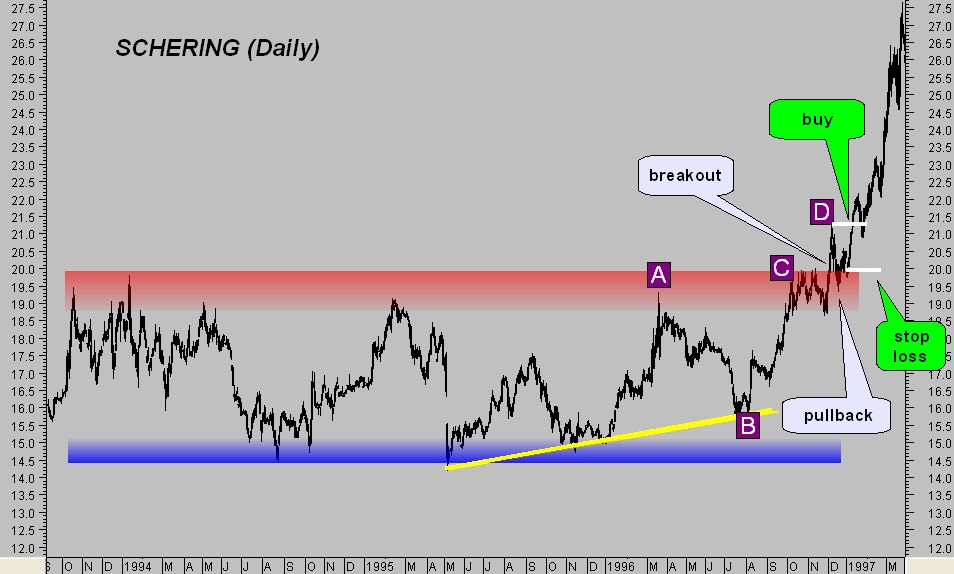
In figure 8 the daily chart of Shering (DAX) is shown. You may see an ill-defined wide trading range which lasted more than three years. The resistance and support levels for this range are not quite clear and so they are presented as red and blue strips respectively (note that the upper and lower boundaries of the red strip are defined by the price data prior to the end of 1995). Since the price declined from point A to point B and then advanced again and entered the red strip, a forewarning signal is given at point C because B is above the blue strip. The price then penetrates the upper boundary of the red strip, reaches point D, pulls back to the red strip and then advances again in new highs. According to the GWTW tactic a buy signal was given when the price overtook the point D with a stop loss threshold the high of the red strip.
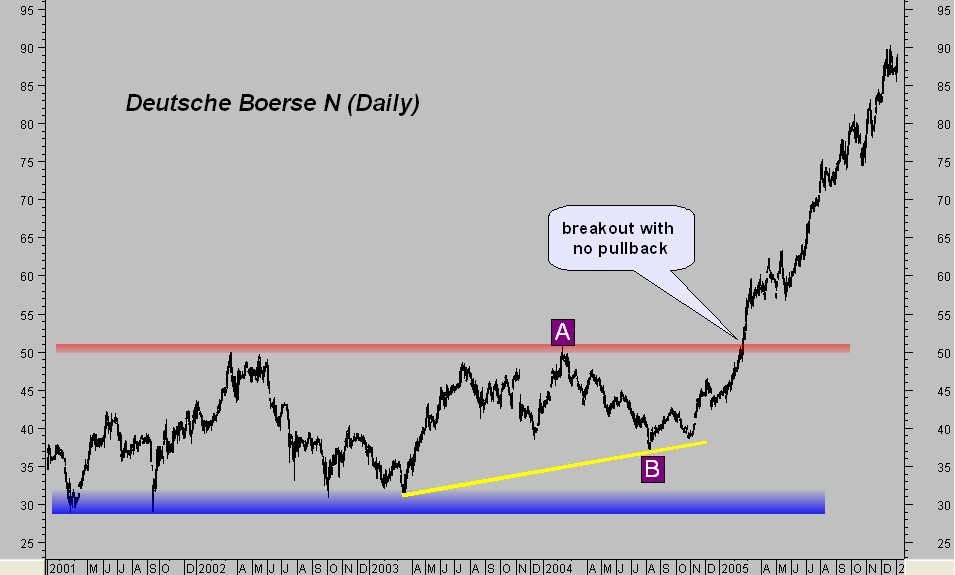
The last chart example is shown in figure 9 where you may see the daily chart of Deutsche Borerse N (DAX). This example was chosen to show you that when a forewarning signal is present (see point B) a breakout may not be followed by a pullback. Generally, upward breakouts of very long term (and preferably narrow) trading ranges after a forewarning signal and under bullish conditions for the general market are prone not to be accompanied by significant (if any) pullbacks.
Epilogue
Breakouts can be extremely profitable when a proper trading tactic is applied. In this article I tried to present two methods of dealing with the breakouts: The GWTW and the CounterAttack. Although I didn't give rigid trading rules for these methods, I believe my article can help you in you trading and your technical analysis research. I chose not to refer to the concept of technical indicators or volume because my intention was to focus just on the price movements. However, I believe that the methods presented here are absolutely incomplete without the aid of volume. My approach to volume spikes,(although controversial for many analysts) which usually accompany breakouts, is presented in my article entitled "Spike Up The Volume" which was published in the June (2005) issue of Technical Analysis of Stocks & Commodities magazine. The "Spike Up The Volume" article supplements the two methods presented here. You will also find the candlestick analysis extremely helpful to both GWTW and CounterAttack tactics. Steve Nison's Japanese Candlestick Charting Techniques is my recommendation if you are interested in learning the candlestick patterns.
Reference & Related Reading
In this article I will briefly review the classic breakout strategy and discuss the Habit Force which is hidden behind the false breakouts. In the sequence I will discuss the CWTW and CounterAttack tactics.
Trading Ranges - Review and Classic Tactics
In figure 1 you may see how a classic trading range looks. As its name implies, a trading range is a strip defined by two horizontal lines (a resistance line and a support line) which encompasses the price values (black line) of a trading vehicle for a time period.

Trading ranges are considered periods of energy accumulation. When the price finally breaks the range, the accumulated energy is unleashed resulting in a significant price movement in the direction of the break. The basic strategy dealing with trading ranges is to wait until a breakout occurs and take a position in the direction of the break. There are, however, a number of short term traders who try to profit from the price oscillations inside the trading range by buying near the support and selling near the resistance. The latter tactic satisfies the hunger of swing traders for action and has a main advantage: the pronounced buy and sell levels. However, there is a debate between trend followers and short time swing traders whether the trading inside a price range gives a significant edge. Some of the usual drawbacks attributed to range trading are:
- When the range becomes clearly visible by more and more traders it is often the time to be cut out, so trying to catch a profitable move inside the range needs a dose of lack.
- The width of the range is not usually enough to compensate the reward/risk ratio (including commissions) and - since time is money - the time spent for monitoring the price squiggles inside the range compensates much of the expected profit.
- Fundamentals seem to play no role behind the price oscillations inside the trading ranges so that the range traders rely upon the technical aspect only.
On the other hand, the traders who base their positions in range breakouts face the frustrating "false breakout" case. In a "false breakout" the price exits the trading range (sometimes accompanied by significant volume) but fails to initiate a trend in the direction of the break. In figure 2 you may see how a typical upward false breakout looks. The price (black line) exits the trading range and eggs traders to take long position with a stop loss threshold the previous resistance line of the trading range. The price then comes back to the resistance line of the trading range, stalls for a while and then reenters the trading range activating the stop loss orders.

The HF Principle
Humans are generally reluctant to change their habits and the same seems to hold for the markets too (besides, humans actually move the markets) . I will hereon refer to the tendency of the markets to maintain their "habits" using the term "Habit force" or simply HF. The HF principle states that the markets incorporate a tendency to maintain their "habits".
One of Dow's main principles about the trend continuation (a trend is active until it is terminated) is a type of HF. The tendency of the price to retrace in the vast majority of trends is also a type of HF since retracements show that the price is reluctant to the change its value and tries to come back to its previous condition.
Pullbacks and the HF Principle - A Philosophic Approach
The vast majority of the breakouts are accompanied by pullbacks. A pullback is formed when the price tries to reenter the trading range after a breakout and this is another type of HF since the price actually tries to continue its oscillating movements inside the range.
In figure 3 the case of an upward breakout accompanied by a pullback is shown. From point A to point C the price has the habit of being inside the range defined by the blue support and red resistance lines (medium term habit). From point B to point C the price is under the effect of short term up-trend (short term habit). As soon as the price reaches the resistance level two forces are applied to it. The short term force tries to pass the price above the resistance and the medium term force tries to send the price back to the support blue line. At this point, considering the old saying "The longer a habit holds, the more difficult to overcome", we would expect the medium term habit to beat the short term one. In other words, even if the price passes above the resistance (point D), the chances are it will come back inside the range rather than continuing up and this is actually true when facing a case like the one shown in figure 3.

If you wonder: "...then why do many technical analysts try to get in a stock as soon as an upward breakout occurs?" the answer is simple: If a breakout turned out to be valid and a trend is initiated in the direction of the break, this trend is usually extremely powerful. Technical analysts try to get in the trend early and gain as much profit as possible but they simultaneously take rigid precautions using tight stops which they respectfully abide by. This is clear in David Ryan's approach to breakouts which is analyzed in the next paragraph.
A Wizard's Approach
In his book Market Wizards, Interviews With Top Traders Jack D. Schwager recites David Ryan's interview. Mr. Ryan uses much of William O'Neil?s stock selection method which relies upon "buying strength" (that is, buying the best performing stocks in both technicals and fundamentals). According to Schwager, Ryan's approach to upward breakouts is to by a stock as soon as it is breaking out of a long term trading range and simultaneously place a stop loss order at the top of the trading range. As Ryan says in Schwager's book: "If the stock reenters its base, I have a rule to cut at least 50 percent of the position. Frequently, when a stock drops back into its base, it goes all the way back down to the lower end of the base".
Even if Ryan's approach is to "buy strength" (thus buying promising and healthy stocks), it is obvious that he respects the HF principle and does not rely upon the premise that an upward breakout must necessarily imply a strong bullish trend. On the other hand, a closer look in Ryan's words may lead to the CounterAttack tactic. If when a stock reenters the trading range it frequently goes all the way back down to the lower end of the range, then it may seem a good idea for short term traders to take a short position at the time the stocks reenters the range after the breakout. I will refer to the CounterAttack tactic later in this article. Mr. Ryan however does not advocate the CounterAttack tactic not only because he focuses in the longer and profitable trends but also because his rigid CANSLIM-oriented stock selection process filters out the stocks which do not meet the criteria for a strong bullish trend. Thus, short selling a strong stock would be very dangerous.
Pullback and the HF Principle - An Empirical Approach
One of the main reasons behind the preference of David Ryan (and almost all technical analysts) to upward breakouts is that after the breakout of a long trading range there is no profound resistance above the price. In other words, all who have bought inside the range are in profit and the stock is not under selling pressure. This is true in most of the cases, especially when the breakout occurs after a very long trading range (lasting several months or years) but the frequency of pullbacks after breakouts shows that actually there is a selling pressure after the breakout by all those who were "stuck" in the stock during the development of the range and finally find the opportunity to get out in a quite favorable price. Only when this selling pressure is dried up the price is capable of going higher.
The Go With the Winner (GWTW) Tactic in Upward Breakouts
Since at pullbacks a battle of a short term habit with a longer one is taking place, a conservative approach is to wait and see who will be the winner before taking action. How could you know who won? For upward breakout cases, simply look for the price to pass the breakout bar after it has pulled back. In figure 4, the best time for taking a long position is neither at A, nor at B or C but at D. At D it is clear that the habit force which was responsible for sending the price from B back to C is not stronger than the habit force which wants the price to go up. This type of trading action (hereafter called GWTW) is of course more conservative than the one which follows the price as soon as the breakout takes place. The main advantage of GWTW is the adaptation to the market condition at the right time. In addition, if the resistance of the previous trading range (red horizontal line in figure 4) is being set as a stop loss threshold, the risk/reward ratio is considerably high for the cases where the BC segment (see figure 4) is not tall enough.

The Forewarning Signal
Are there any price signals that can forewarn of a possible breakout? The answer is yes in most cases. Many upward breakouts usually take place after a failure of the price to get quite close to the support level of the trading range. Inside a trading range, the habit of the price is (by definition) to move from the low of the trading range to the top of it. A failure of the price to reach the low of the range indicates its tendency to change this habit. In figure 5 you can see an iconic case of an upward breakout. The price oscillates inside a trading range and sequentially touches the red and blue lines which define the range. After reaching a local high point A the price declines at point B which is well above the support level (blue horizontal line) but lower than the midline of the trading range. In the sequence, the price advances sharply (point C) and then breaks the resistance level (red horizontal line). The forewarning signal is given at point C.

The GWTW strategy is capable of saving you form the frustrating case where the price pulls back and reenters the range (point D) thus activating the stops. Even if the price reenters the range there is still hope for a profitable long position if the price fails to reach the support level of the range (point E) and more preferably if it fails to fall below the level of point B. The buy signal is given at point F where the price overtakes the initial breakout with a stop loss threshold the high of the trading range. Note that the iconic example of figure 5 is the general case. Many times the price will not decline to point E after the breakout and it will quickly pass from point D to point F. Also, notwithstanding that in figure 5 I have presented a pullback, the forewarning signal is generally a significant indication that a pullback may not be formed and is of the cases where it may be worth taking action at the breakout especially if the breakout takes the price in all-time highs. In short, when you are considering the case of taking action at the breakout without waiting for a pullback check to see if a forewarning signal has occurred as this will increase the odds for you.
The Conterattack Tactic
Trading ranges whose support/resistance boundaries are not clearly defined are more prone to produce false breakouts since the breakout itself is difficult to define and seen. In such cases short term traders may gain profit by the CounterAttack tactic. For this tactic, the support/resistance boundaries of the range (which will be used to provide breakout signals) must be defined in such a way that the range contains the vast majority of the price and leaves outside only very brief exaggerations (spikes etc.) If the price reenters the range after an upward breakout a sell signal is activated with a stop loss threshold the highest price after the breakout and first target the middle of the trading range (and next target the low of the range).
The CounterAttack tactic can also be applied in well defined trading ranges. The rational behind this is that many technicians use the resistance of the trading range as a stop loss threshold when they take long positions at the breakout. Thus, when the price clearly reenters the range a cascading of stop loss orders are activated resulting in a price decline.
There are some things you must keep in mind concerning the CounterAttack tactic. First, the reward/risk ratio is of extreme importance. The trading range must be wide enough to compensate for the associate risk as defined by the stop loss level. Second, it would be prudent to use an appropriate filter to determine if the reentering of the price inside the range is acceptable and this is because after a breakout there are traders who await the pullback and place their buy orders at the resistance level of the range. Third, there must be no forewarning signal prior to the breakout.
Chart Examples
Though I discussed the GWTW and CounterAttack tactics for the upward breakouts they can also be applied in downward breakouts with the appropriate conversions.
In figure 6 the daily chart of Applied Materials (NDX) is shown. The blue and red horizontal lines define a trading range. The A, B, C and D points indicate false breakouts and the blue arrows indicate possible entry points for the CounterAttack tactic. The green horizontal segments show preferable stop loss thresholds.

A similar example is shown in figure 7 this time with the daily chart of Linear Technology (NDX). CounterAttack signals (blue arrows) after points B and C are clear (the green horizontal line segments show the stop loss thresholds). A downward sell signal is shown after point A with a question mark above it to show that based only upon the information from the price chart this CounterAttack signal is extremely risky. The reason for this is the forewarning signal at A (note the price movement from point X to point A and the low at Y).

In figure 8 the daily chart of Shering (DAX) is shown. You may see an ill-defined wide trading range which lasted more than three years. The resistance and support levels for this range are not quite clear and so they are presented as red and blue strips respectively (note that the upper and lower boundaries of the red strip are defined by the price data prior to the end of 1995). Since the price declined from point A to point B and then advanced again and entered the red strip, a forewarning signal is given at point C because B is above the blue strip. The price then penetrates the upper boundary of the red strip, reaches point D, pulls back to the red strip and then advances again in new highs. According to the GWTW tactic a buy signal was given when the price overtook the point D with a stop loss threshold the high of the red strip.

The last chart example is shown in figure 9 where you may see the daily chart of Deutsche Borerse N (DAX). This example was chosen to show you that when a forewarning signal is present (see point B) a breakout may not be followed by a pullback. Generally, upward breakouts of very long term (and preferably narrow) trading ranges after a forewarning signal and under bullish conditions for the general market are prone not to be accompanied by significant (if any) pullbacks.

Epilogue
Breakouts can be extremely profitable when a proper trading tactic is applied. In this article I tried to present two methods of dealing with the breakouts: The GWTW and the CounterAttack. Although I didn't give rigid trading rules for these methods, I believe my article can help you in you trading and your technical analysis research. I chose not to refer to the concept of technical indicators or volume because my intention was to focus just on the price movements. However, I believe that the methods presented here are absolutely incomplete without the aid of volume. My approach to volume spikes,(although controversial for many analysts) which usually accompany breakouts, is presented in my article entitled "Spike Up The Volume" which was published in the June (2005) issue of Technical Analysis of Stocks & Commodities magazine. The "Spike Up The Volume" article supplements the two methods presented here. You will also find the candlestick analysis extremely helpful to both GWTW and CounterAttack tactics. Steve Nison's Japanese Candlestick Charting Techniques is my recommendation if you are interested in learning the candlestick patterns.
Reference & Related Reading
- Nison, Steve [1991]. Japanese Candlestick Charting Techniques , New York Institute of Finance.
- Schwager, D. Jack [1989]. Market Wizards. Interviews With Top Traders, New York Institute of Finance.
- Siligardos, E. Giorgos. Spike Up the Volume, Technical Analysis of Stocks & Commodities, V 23.6, June 2005.
- O'Neil, William [1999]. 24 Essential Lessons For Investment Success, McGraw-Hill.
- O'Neil, William [2002]. How To Make Money In Stocks, 3d ed, McGraw-Hill.
Last edited by a moderator:
