Annas Stocks
Newbie
- Messages
- 7
- Likes
- 0
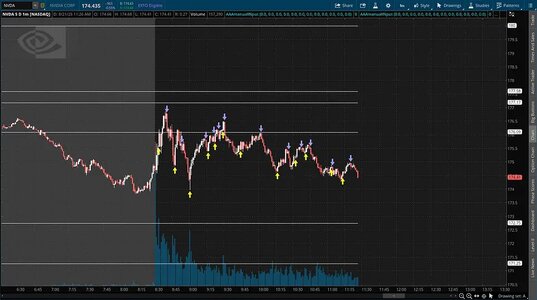
Premarket weakness gave way to a sharp recovery off 171.25 at the open, driven by aggressive volume.
First rejection at 176.09 set the tone. Multiple lower highs confirmed sellers were in control.
Support at 172.35 and 171.25 held intraday, but upside remained capped as volume faded.
Key levels respected perfectly:
Resistance: 177.58 → 176.09
Support: 172.35 → 171.25
Structure: Descending triangle
Volume: Strong open >150K/min, then taper likely institutional unloading
What traders should do:
Intraday Short into resistance / scalp at support only with confirmation
Swing Watch 177.58 breakout or 171.25 breakdown for next major move
Options/Futures Stay tactical. Avoid chasing. Let levels lead.
Clean moves. No guessing.
Executed the plan structure over sentiment.