Annas Stocks
Newbie
- Messages
- 7
- Likes
- 0
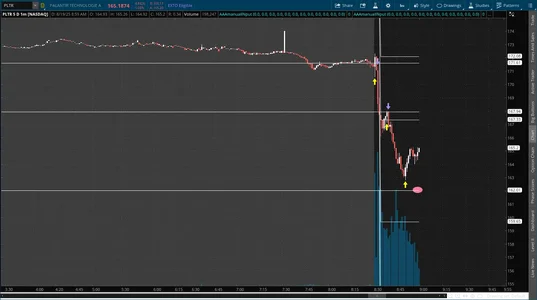
This morning, $PLTR saw a massive gap down at the open dropping nearly $8+ in minutes. Traders woke up to a bloodbath as volume spiked hard. Let’s unpack what this means
The drop wasn’t random. Notice the huge sell imbalance right at 8:30 AM. Institutions likely unloading positions. Retail traders who chased highs yesterday are now trapped.
Key levels to watch on this chart:
For day traders:
Nothing about Palantir’s fundamentals changed overnight. These moves are often market psychology, not company collapse. Always separate price action vs business value.
What’s next?
If $PLTR can reclaim $167, we may see a grind back toward $170+.
If it loses $162, sellers likely push toward $160 and below.
Don’t chase, don’t panic. Levels + volume always tell the story. Today, $PLTR gave us a perfect example of how institutions use fear to move markets.
PLTR 162.01 next?
The drop wasn’t random. Notice the huge sell imbalance right at 8:30 AM. Institutions likely unloading positions. Retail traders who chased highs yesterday are now trapped.
Key levels to watch on this chart:
- Resistance near $172 (previous support turned resistance)
- Mid-level at $167 (failed bounce attempt)
- Support around $162 (buyers stepped in here today)
For day traders:
- Short entry was clean on the break under $167
- Scalpers could have caught the bounce off $162
- Risk/reward was crystal clear if you waited for confirmation
Nothing about Palantir’s fundamentals changed overnight. These moves are often market psychology, not company collapse. Always separate price action vs business value.
What’s next?
If $PLTR can reclaim $167, we may see a grind back toward $170+.
If it loses $162, sellers likely push toward $160 and below.
Don’t chase, don’t panic. Levels + volume always tell the story. Today, $PLTR gave us a perfect example of how institutions use fear to move markets.
PLTR 162.01 next?