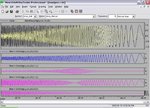
Noxa indicators for Neuroshell

Hi

P.Z & Noxa Shame on you, you wrote as you are not Vendor of Noxa CSSA
post #2,#4 example. I think it''s cheating.
There is some rules in this web site.

I have been using noxa for two weeks now, it is promising..........

I think there is problem with Noxa and NeuroShell's GA fitness function = How good system is.
I hope in future it's possible to write own function which tells if system is good or not, these win-loss ratios,maximize account, probability etc...is not enough for noxa.
Like test if Wealth Lab Score, or Lissajous pattern.......... can help.

It can't find optimal/robust solution for Noxa, without doing semi automatic learning. stopping and retrain. It's not usually purpose of NN,GA and evolutionary learning systems.
It's crazy,people have to help technology and technology is not helping people.

If I can't find solution for that have to think how to use Noxa,not really want to think its waist of money.I hope I was reading end of this thread. and not read couple post where you and krys made arguments. and get tired.

I will not watch screen and wait and retrain, have to also do something else.

I think noxa or noxa/neuroshell combination can't generalize problem.
If noxa can make own GA/Fitness function to find good parameters. There is lot of free good GA code in net.

At Least you can make tutor where is step by step how to find good parameters,for groups start and group depths,and m-history a) using eigenvectors, b) what training functions works best,how many periods for learning etc.....

For me you help file is not enough, had to read this thread to get some usefull information.

Anyhow I will test two weeks more noxa because I allready have made several promising strategies lets see how they work in future.
 
I have two strategy setups. These are eod stocks.
a) Long optimizing,medium paper trading, medium trading.
b) Long noxa train end,short optimizing,short trading. I will skip paper trading. I will retrain every week and check what are results. and I will neuroshell perform optimizing till end.

I am doing only long trades. Long entry, using below q-phase, and long exit using above q-phase
 
Basic Questions

Hi,

I have a few basic CSSA questions I thought you guys could answer. I'm only on post #25 btw but I thought you guys could provide better answers. If you need any clarification, feel free to ask.

1. If Qphase is the “quadrature” version of cycle, why would it be more accurate than the original cycle indicator?

2. I know robustness is important for optimization; how does this work regarding CSSA indicators?

3. What is the relationship between showrange, train start, train bar, etc? What am I supposed to do here? Am I supposed to find the range that “captures” the most of the market and make it into cycles? Any guidelines? How do I actually go about choosing train start and bars?

4. In the eigenvector lissajou diagram, are we trying to get as close to a circle as possible? Because this means persistence or something (what does it mean again)? In help files, it says plateau in spectrum is usually indicative of significant structure – how is circle related (since it can’t be both)?

5. Are percent variance, coupling index, and change point score all related to finding possibility of trend change? Is that really it?

6. When optimizing, how do we determine range of optimization and how do we make a variable the same for different uses (i.e. one variable for multiple settings : 1 variable m-histories for all cssa indicators, instead of optimizer trying different settings for all cssa indicators, which would increase time and get different values)

7. Once you find good parameters, do these parameters apply for all cssa indicators? I’m guessing yes. But wanted opinions.

Thanks!
 
Using noxa and Predictions.

Why is not possibleto use noxa using predictions. ?
Or add noxa indicator to predictions and let neuroshell optimize parameters ?
I am just thinking if possible to us predictions, and small ammount of hidden neurons,and maybe avoid overfitting.
 
Why is not possibleto use noxa using predictions. ?
Or add noxa indicator to predictions and let neuroshell optimize parameters ?
I am just thinking if possible to us predictions, and small ammount of hidden neurons,and maybe avoid overfitting.

If you want more clarification about optimization just read this

Trading newsletter :: The Breakout Bulletin

there is a few articles about it. You can also have a look to R. Pardo book.

Krzysztof
 
Hi vvierailija,

It is certainly possible to use CSSA in predictions.

The challenge is that often the resonant cycles tend to come and go. They may only last a few cycles if that. This suggests using only the more recent bars only (maybe 50-100) to train your prediction. However the smaller the amount of data you train on, the more likely you are to overfit. So, if you are training on only the more recent bars then you'll need to limit the number of neurons and parameters as far as practical.

Like all predictions, you probably want to start with inputs which you can see visually have some predictive value. While NST is really useful, it's not too suited to magically working out the golden set of rules for you. You'll nearly always need to apply some visual inspection when building a model. If it was as easy as clicking a button we'd all be rich.

Having said all of that, you may want to experiment with the following approach -
1) Identify three cycles that seem to have predictive value for your stock when they are active. This will need to be done visually. If you want to be lazy just pick any three (say 3, 7 and 11) but you however don't expect as good a results.

2) Next create a prediction for each. Limit the number of hidden neurons down to 2 or 3 and use the cssa cycle and it's one bar lag as the two inputs. Don't allow parameter optimisation. Predict say 3-5 bars ahead. All this is doing is creating a leading indicator. Alternatively, instead of using a prediction you could subtract two identical cssa cycles with zero and 3-5 bar leads to give you a measure of expected cycle move.

3) Finally create a trading strategy or prediction which combines these three net outputs. As a few common observations which I have noticed -
a) When all three inputs suggest an upturn it is more likely to go up
b) Those cycles which are bigger in magnitude and/or growing will often be more reliable
c) Often an extreme event will occur setting all the curves 'swinging'. At a future time they will tend to come back into sync and this is a good time to trade. For example imagine a stationary ship. It has three pendulums with periods 1s, 1.5s and 2.0s. The ship gets a large bump causing all pendulums to swing. There will be a time all pendulums will come back into sync (6s) and will all move off in the same direction again.
d) There are times when nearlly all of the cycles will go quiet. This is a good time to set up a breakout strategy as the market is wating and 'listening' for news and will generally be highly sensitive to it.
e) For each of the three predictions you've created you'll note that they perform best when the correlation between the signal and the actual is strongest. That is, if it has been predicting well for the past 20 bars then it is probably going to work well for the next few.

NOTES:
1) The CSSA cycles are not normalised, so if the magnitude of price changes significantly (eg $1.00 to $4.00), your cycles will also change (eg 0.10 to 0.40) and hence your predictions will most likely no longer work. There are various methods for normalising this (eg 50 bar stochastic) but that is another topic.

2) The above method of creating multiple predictions and feeding them into another may in many cases help to prevent overfitting. While ultimately there are still the same number of variables it is less likely that they will be fitted together in unison.

Would love to hear anyone else's ideas.

Hope this helps,

Stewart

Are you able to calculate profit factor and % profitable trades for this strategy ??

Krzysztof
 
Anybody can help me?

How can I display "Range Bars" Chart on Neuroshell with datafeed from MTFeedPro? It seems not working, even with real time ticks.

In the display it writes "No Data is available for Close". Other chart types (seconds, minutes, ticks, volumes etc) are working normally, just this "Range Bars" chart don't work.
 
Hi,
MT4 normally (default) does not support range bars chart. There is some implementation of this idea:
Range Bar Chart on MT4 - Forex Trading
If you get it in MT4, try open range bars chart in NS but I didn't test it.
Regards

Anybody can help me?

How can I display "Range Bars" Chart on Neuroshell with datafeed from MTFeedPro? It seems not working, even with real time ticks.

In the display it writes "No Data is available for Close". Other chart types (seconds, minutes, ticks, volumes etc) are working normally, just this "Range Bars" chart don't work.
 
multiple time-frame switching

What I have found to be consistently true about Noxa-CSSA is that price action switches from one timeframe to the next. I look for direction in higher time frames and look for entries in lower ones. I suspect the reason it works is because the larger time frames represent the fundamental needs of companies to pay for future goods and the smaller ones represent small traders in various time frames of trading.:cheesy:
 
A million THANKS to Krzysiaczek99 and NOXA who gave me ,as a reader, a valuable knowledge here.

Special appreciate & thanks to Krzysiaczek99. You are so good in evaluation of trading strategy especially in cycle softwares which currently available in the market.

BTW .... Krzysiaczek99, how can I reach you via mail since I have some question regarding MESA and cycle trading strategy.
 
Often enough one can meet people who sit in pubs and discuss life, love, politics, football etc. etc. Simply, human mind needs jogging, same as human feet do. Those subjects are very convenient for pub waffle because one can kill lots of time without ever getting in a danger of making a practical conclusion.

It seems that a whole bunch of guys, here on this forum, just have discovered such a new topic: an wonderfully complicated indicator, with super high fiddle factor. So young brains are now salivating on all the complicated things they can endlessly do and do and do. Obviously, this bunch of guys is forgetting one little thing: trading!

I bet my last dollar that nobody here, who bought that NOXA indicator have made a single penny with it in any markets. Obviously, including the developer.
 
You are right. There is a huge excitment for the more analytical of us with Noxa's tools. Many of us enjoy the process of developing a trading system more than trading itself, and possibly even the money which such a system can generate in the right circumstances.

Having said that you are not right regarding no-one using this for commercial trading. According to Noxa they have hedge-fund clients who are using this to some extent commercially and they themselves use it for trading ETFs out of Metastock. I am currently using a bandpass filter as my main trading tool which is effectively identical (in concept) to Noxa's. Like any trading system it isn't perfect but I find it is the most reliable of my indicators.

Bandpass has not so much common with CSSA. If you can get response like in the picture below from CSSA let me know.

From my point of view I just tested CSSA to know what it does exactly and me and I hope the readers have a picture now.

My current system have around 20 strategies applied to 6 currency pairs on 1m at real time and I don't use CSSA for it but if somebody has a success with it than hopefully can let us know.

Krzysztof
 

Attachments

  • bandpass.JPG
    bandpass.JPG
    93.9 KB · Views: 480
No, actually each of the cycles produced by CSSA is effectively behaving as a band-pass filter. You can actually compare the output of a CSSA cycle with say an equivalent MESA8 BandPass filter or indeed digital Butterworth filter and get a near identical result.
 
No, actually each of the cycles produced by CSSA is effectively behaving as a band-pass filter. You can actually compare the output of a CSSA cycle with say an equivalent MESA8 BandPass filter or indeed digital Butterworth filter and get a near identical result.

I never tried. But maybe you will post the settings and the picture ??

I have one strategy based on Ehler's bandpass sometimes but not often it makes money.

Krzysztof
 
Krzysztof,

As an owner of both MESA8 and CSSA I too was surprised to find that the MESA8 BP returns very similar output to CSSA-cycle (obviously for the correct tuning).

MESA8 has the enhancement of trying to tune this BP for you unless you tell it not to (ie use BP vs Cycle). CSSA on the other hand has the enhancement of using an entropy/distrubance calculation to rank the bandpass filters in order from most disturbance to least.

I say these are 'band-pass' as they only include frequencies within a certain band. Lower frequencies (ie trend) and higher frequencies (ie noise) are excluded leaving just a narrow range. In reality, like any digital filter of finite length it is not perfect (as you outline). You can see this inperfection in a graph of attenuation vs frequency. It gets even uglier when you start using non-sinusoidal waveforms or rapidly changing frequencies. In addition, you often get the effects of harmonics incorrectly being let through the bandpass too.

Having said all that, is it useful for trading? I guess we let the reader be the judge. It sounds like you have found things that work for you, and I have for me. I find the concept of bandpass filters to be quite effective, especially when used across multiple timeframes. Having said it takes a while to learn to tune them to be useful.

Good luck with your trading.

Stewart
 
Last edited:
PS. On the subject of Forex, I find that cycle-based indicators work best on longer time-frames (eg Monthly, Weekly, Daily) rather than shorter ones. This longer term cycle-derived direction could then be used to limit your shorter term (day) trading to only be in the direction of this longer term cycle.

I'll probably get flamed over-simplifying things ;)
 
Last edited:
Top