Noxa indicators for Neuroshell

Last edited:
LAG and ghost orders

Hi NOXA,

Long time no speak, I was busy with finding 'perfect' spectral system like a Goertzel, MESA or whatever. Seems not to be easy, repainting indicators, future leaks + a lot of guys making theories without proper verification or without any verification at all .

Two questions

I made a test to find out lag response from CSSA and it seems that

1) Lag of CSSA is size of observation window (M-history)

2) Some ghost orders are generated after change of signal conditions.

Signal was build like 20/50/100 bars cycles + trend component + noise than changed just to simple trend.

Any idea how to remove this lag and obtain 0 lag response and remove those wrong orders ??

Krzysztof
 

Attachments

  • cssalag1.JPG
    cssalag1.JPG
    191.7 KB · Views: 514
  • cssalag2.JPG
    cssalag2.JPG
    181.5 KB · Views: 558
  • 20_50_100_T_N_and_down.csv
    124.6 KB · Views: 316
Hi Group (and Noxa),

Firstly I´ve enjoyed this thread, especially the posted examples and comparrisons with tradional DSP. I´ve recently purchased CSSA for NST and so far like what I´ve seen. I do have a few questions. Hopefully they are not too simple in comparrison to the previous discussion.

1) When viewing the ShowEigenvectors, what exactly are we looking for? I have read the help several times over and understand that the first is the dominant contribution (ie trend) and that successive Eigenvectors represent the further cycles arranged in diminishing order. When I look at the green window for say Eigenvector 2 and see a 1.5 wavelengths in the window what is this telling me? Am I assessing it´s smoothness (likeness to a sinusoid) to determine if it is noise free and hence usable, or is it telling me that 1.5 wavelengths of data are given over a span of say mhistories 50, meaning a wavelength of about 33 bars!? I have noticed that reducing the mhistories makes the ShowEigenvectors less smooth.

2) In the examples given when you buy CSSA, many examples use a group start of 9 and group size of 4, meaning Eigenvectors 9 through to 12 inclusive. I would have expected that the more prominent Eigenvectors (ie 2 thorugh to 5) or such like would have been more useful for trading as they are more prominent. Comments?

3) I´ve also been comparing your free SSA with the CSSA which I bought. I understand that CSSA is causal meaning that the CSSA cycles created on past data is not changed as new data comes in, where as SSA is constantly adjusted its curves historically with the knowledge of new data coming in. However, is SSA forward looking? By that I mean if we are training on 1 Jan 2008 till 31st Dec 2008 data but the chart contains a further few months data (say till 1 Apr 2009) will those future three months be used by the SSA algorithm while training? And similarly, when SSA is training for the date of the 1 July 2008, will SSA have knowledge of the curve ahead? That is assuming that the mHistory was set to say 50 so that it is at the beginning of 2008.

4) You mention a procedure in NST of repeadedly stopping and restarting the training in order to avoid overfitting. I understand the concept of overtraining. The stop-start procedure seems odd to me though. How would it yield a better result than just letting it training run, given when you restart training NST asks you to continue with existing values. Do you have any reference to articles on this stop-start procedure or explanation of this?

Thanks for your time.

Windsurfing Stew
 
Hi NOXA,

Long time no speak, I was busy with finding 'perfect' spectral system like a Goertzel, MESA or whatever. Seems not to be easy, repainting indicators, future leaks + a lot of guys making theories without proper verification or without any verification at all .

Two questions

I made a test to find out lag response from CSSA and it seems that

1) Lag of CSSA is size of observation window (M-history)

2) Some ghost orders are generated after change of signal conditions.

Signal was build like 20/50/100 bars cycles + trend component + noise than changed just to simple trend.

Any idea how to remove this lag and obtain 0 lag response and remove those wrong orders ??

Krzysztof

Hello All Ladie and Gentlemen here,

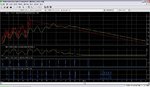
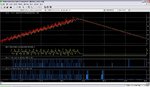
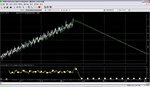
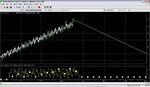
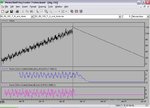
I got a template in NShell, it look very profitable but I'm having problems sending odrer to Mt4, Here is the system screen shoot at FreeImageHosting.net Hosting Service and FreeImageHosting.net Hosting Service. I'm using Tradeput EA in MT4 here is the shot at FreeImageHosting.net Hosting Service

Plese PM or email me at [email protected] for the template.

Thanks

tgt123


Since there is no one willing to find or maybe unable to tell what the reason this syem cant send order to MT4, i ppost the template here for further discussion!
 

Attachments

  • TS sasà 15 min + Tstop40 lyvyo.zip
    361.9 KB · Views: 373
hi guys!

@Krzysiaczek99:
ad 2.) do this also appear when you use "No optimization" in NSDT? (I think your talking about trading live/demo, when this happen?)

@tgt123:
I also have this template you posted, but in my opinion it is useless in live tradeing.
Try the following, change or remove the DT_SSA Indi and make a test.
bad results. SSA is not for trading, wether Noxa's free SSA nor DT_SSA. This is my understanding, but please tell me when you have an other opinion/experiance!
(see windsurfing_stew post, ad 3.))

@windsurfing_stew: ad 4.)
This is what I sometimes do. I (start/)stop and I get better trading results when I stop the training at the half time of optimization, then let it optimise it to 100%.
But if this is what Noxa meant, I don't know...

bye, AT
 
Lag and addaptiveness of CSSA

hi guys!

@Krzysiaczek99:
ad 2.) do this also appear when you use "No optimization" in NSDT? (I think your talking about trading live/demo, when this happen?)

bye, AT

my previous post was related to signal change during trading and showing that CSSA will generate wrong cycles as it has kind on memory due to sliding m-history window.

I found another strong weakness - lack of addaptiveness which I believe was recognized by traders. Below 2 scrennshoots. Signal is build: 1000 bars of raising cycles with noise + 1000 bars of falling downtrend (down line).

1st screenshoot - training start = 1, training bars = 500 result cycles recognized very well.

2nd screenshoot - training start = 1200, training bars = 500 cycles not recognized almost at all.

So as long as a cycles/patterns are included in training bars range CSSA is recognizing them. But when a new pattern/cycle shows up CSSA is not able to adapt to it.

So as a summary of those 2 posts we can say that CSSA has a big lag in case of signal change plus will not adapt to not included in training range patterns.

Krzysztof
 

Attachments

  • 1200.JPG
    1200.JPG
    147.7 KB · Views: 507
  • 500.JPG
    500.JPG
    149.4 KB · Views: 486
@Krzysiaczek99:

I am quite confused. Do you refer to the trendline or to the cycle indicator lagging? Your top charts show a trendline lagging which to me is expected to be lagging as any other historical trendline does. If I read Noxa well however, the cycles do not lag and I can see that on the charts posted on this forum.

Now if I read you well, Noxa is 3X better than Goertzel (your post below). Was that with respect to the trendline or the cycle?
Forex Factory - View Single Post - Optimized Trend Trading


You seem to believe this is a strong weakness. Do you know any other indicator that adapts and does not lag?


One more clarification:
>> 1st screenshoot - training start = 1, training bars = 500 result cycles recognized very well.
>>2nd screenshoot - training start = 1200, training bars = 500 cycles not recognized almost at all.

Do you mean that the data has two different cycle contents?
 
How stupid

my previous post was related to signal change during trading and showing that CSSA will generate wrong cycles as it has kind on memory due to sliding m-history window.

I found another strong weakness - lack of addaptiveness which I believe was recognized by traders. Below 2 scrennshoots. Signal is build: 1000 bars of raising cycles with noise + 1000 bars of falling downtrend (down line).

1st screenshoot - training start = 1, training bars = 500 result cycles recognized very well.

2nd screenshoot - training start = 1200, training bars = 500 cycles not recognized almost at all.

So as long as a cycles/patterns are included in training bars range CSSA is recognizing them. But when a new pattern/cycle shows up CSSA is not able to adapt to it.

So as a summary of those 2 posts we can say that CSSA has a big lag in case of signal change plus will not adapt to not included in training range patterns.

Krzysztof

You moron! Look at your training range (see green area in the graph). You train CSSA on nothing!!! no cycle, no nada!! just a stupid down line. How can CSSA learn from nothing!
 

Attachments

  • training.gif
    training.gif
    7.2 KB · Views: 256
You moron! Look at your training range (see green area in the graph). You train CSSA on nothing!!! no cycle, no nada!! just a stupid down line. How can CSSA learn from nothing!

Interesting. Some newer posting member suddenly shown up wit expert opinion :)

The title of my post was lack of adaptiveness and my post proves lack of adaptiveness.

By setting the training range on down line you can see that cycles from the left part of the chart are not recognized and it proves lack of adaptiveness i.e. pattern to be recognized must be in trainning range, if it is not than it is not recognized and this is lack of adaptiveness.

Regarding lag. Both Goertzel and CSSA have big lag, too big to be used effcient in real time trading.

Krzysztof
 
Last edited:

Boys get upset because i pointed usage of repainting indicators in their systems.

BTW. Can you give a link to any post of you which will prove that you have any competence for a discussion ?? I never seen you posting anywhere....

Krzysztof
 
Last edited:
Hi Group!

I'm new to Noxa CSSA and am working through learning to use the product. There has been quite a lot of
quite academic debate on this forum to date. I'm hoping that I might put forward an real life example of
how I have used the software for you guys (the experts) to critique. I can't say I've achieved much, but am
trying to do my best for a somewhat randomly chosen example piece of data.

1) I'm using Australian All Ordinaries XJO index between 1/1/2002 to 31/12/2005. On visual inspection you
can see some trend component and some cyclic component. I'm looking configure CSSA to to give me
something of value. FIGURE 1 - ASX index sample.

2) Next I view the Eigenvectors and notic that there are nice plateaus at 9 and 10, 11 and 12, 13 and 14, 17 to
19. These groups, especially the first (ie 9 and 10) seem to have quite circular Lissajous which is according to
the help good as it indicates quadrature. FIGURE 2 - Eigenvectors.

3) I add these four cycles to my chart. FIGURE 3 - Added Cycles.

4) Finally I move to a part of the chart where I notice the top 2 CSSA cycles seem to be increasing in
magnitude. I've marked somewhat arbitrarily on a few buy (green) and sell (red) points based on where the top
two CSSA curves (ie sum of them) seems to have turned. Interestingly the bottom two curves don't seem to
help much. FIGURE 4 - Manually Drawn Trade Signals.

This is my example. I've probably stuffed a whole heap of bits up, so feel free to comment.

Regards,

Stewart

FIGURE_1_-_ASX_index_sample
FIGURE_1_-_ASX_index_sample.jpg


FIGURE_2_-_Eigenvectors.jpg


FIGURE_3_-_Added_Cycles.jpg


FIGURE_4_-_Manually_Drawn_Trade_Signals.jpg
 
Last edited:
Hi Group!

I'm new to Noxa CSSA and am working through learning to use the product. There has been quite a lot of
quite academic debate on this forum to date. I'm hoping that I might put forward an real life example of
how I have used the software for you guys (the experts) to critique. I can't say I've achieved much, but am
trying to do my best for a somewhat randomly chosen example piece of data.

1) I'm using Australian All Ordinaries XJO index between 1/1/2002 to 31/12/2005. On visual inspection you
can see some trend component and some cyclic component. I'm looking configure CSSA to to give me
something of value. FIGURE 1 - ASX index sample.

2) Next I view the Eigenvectors and notic that there are nice plateaus at 9 and 10, 11 and 12, 13 and 14, 17 to
19. These groups, especially the first (ie 9 and 10) seem to have quite circular Lissajous which is according to
the help good as it indicates quadrature. FIGURE 2 - Eigenvectors.

3) I add these four cycles to my chart. FIGURE 3 - Added Cycles.

4) Finally I move to a part of the chart where I notice the top 2 CSSA cycles seem to be increasing in
magnitude. I've marked somewhat arbitrarily on a few buy (green) and sell (red) points based on where the top
two CSSA curves (ie sum of them) seems to have turned. Interestingly the bottom two curves don't seem to
help much. FIGURE 4 - Manually Drawn Trade Signals.

This is my example. I've probably stuffed a whole heap of bits up, so feel free to comment.

Regards,

Stewart

Stewart,

I can see that your the training range is set by default 1~10000 meaning that the cycles are in-sample. I suggest that you set it so that you show the cycles on hold out data.

Identifying propagation modes (pairs of similar amplitudes) is usually helpful as it helps identifying structure in the data. The claim is that propagation modes have some predictive skills. Now the ultimate judge as to what cycle composite is the most appropriate will be your equity line.

Noxa
 
Regarding ghost orders

Hi NOXA,

Long time no speak, I was busy with finding 'perfect' spectral system like a Goertzel, MESA or whatever. Seems not to be easy, repainting indicators, future leaks + a lot of guys making theories without proper verification or without any verification at all .

Two questions

I made a test to find out lag response from CSSA and it seems that

1) Lag of CSSA is size of observation window (M-history)

2) Some ghost orders are generated after change of signal conditions.

Signal was build like 20/50/100 bars cycles + trend component + noise than changed just to simple trend.

Any idea how to remove this lag and obtain 0 lag response and remove those wrong orders ??

Krzysztof


No worry! There no ghosts in the machine.

Multiple orders from Entries#0 are indicative of something going wrong in your system (inappropriate rules, wrong choice of cycle, excessive noise, contaminated data …). Here, the issue is that there is no cycle in the data; it is not a concern at all as it will never happen in real market conditions. But CSSA is kind enough to warn you that something is wrong!! How smart!!

How CSSA does it? There is no cycle in the data so the Cycle indicator generates a flat line (see red curve in chart attached). But since this line is calculated it might exhibit residual noise mostly from floating point errors. We zoomed in on the flat line to show the noise (see green curve). As you can see in the graph this noise has a 3 bar period and despite its very small amplitude (< 0.0000001) the entries#0 indicator still picks it up hence the multiple entry signals.

As I said this is a non issue. But you can still get around it! How sweet!

1. Use entries#2 or a QPhase crossover as I said before (see bottom two curves); a threshold line is set so that no signal is generated.

2. Test at which level the signals occur; filter out the signals that look invalid. Entries#0 are perfect for building Bottom-Up systems which start with raw signals; it gives you the freedom to filter them out as you wish.

Noxa
 

Attachments

  • 20-50-100-T-N and down.gif
    20-50-100-T-N and down.gif
    22.9 KB · Views: 523
Trendlines always lag

Hi NOXA,

Long time no speak, I was busy with finding 'perfect' spectral system like a Goertzel, MESA or whatever. Seems not to be easy, repainting indicators, future leaks + a lot of guys making theories without proper verification or without any verification at all .

Two questions

I made a test to find out lag response from CSSA and it seems that

1) Lag of CSSA is size of observation window (M-history)

2) Some ghost orders are generated after change of signal conditions.

Signal was build like 20/50/100 bars cycles + trend component + noise than changed just to simple trend.

Any idea how to remove this lag and obtain 0 lag response and remove those wrong orders ??

Krzysztof


The CSSA-Trendline lags as each trendline does and there is no way around it if you don’t know the trend. The CSSA-Cycle however usually does not lag (see chart attached, bottom graph).

>> 1) Lag of CSSA is size of observation window (M-history)

This is not correct. The CSSA-Trendline lag depends on how many and what components are being used in the group. The more components in the group, the less lag; ultimately, when all components are used, price is fully reconstructed with no lag. As you can see in the chart attached, the CSSA-Trendline (red curve) lags the Cycle by about 2 to 3 bars only in this configuration; certainly not 50 bars!

Noxa
 

Attachments

  • 20-50-100-T-N and down #2.gif
    20-50-100-T-N and down #2.gif
    23.2 KB · Views: 499
Each of us certainly has his own very personal approach with trading. Here are a few general principles that I learned with NeuroShell over the years and happen to work very well for me.

1. Don’t measure the market but be the market. Obvious patterns are washed out almost instantly. Pretty much only the faint patterns resist market efficiency; only the faint patterns are left over for us to be exploited. Trying to measure them has detrimental effects. For example taking a moving average introduces a lag; any indicator for that matter induces some sort of distortion making it almost impossible to find genuine patterns. It makes sense after all; the Heisenberg uncertainty principle also applies to markets.

2. Try to make non-stationary inputs stationary; non-stationarities in markets cannot be exploited. Think of a system that would be fully adaptive: you would not be able to do better that just looking at price. NeuroShell however gives a static picture of markets meaning that it is possible to generate equity with it by picking stationary patterns (something that lasts); unfortunately these patterns are quite rare so why not inferring them? That also includes selecting carefully the data on which to optimize the system.

3. Think in terms of the cause not the effect. Patterns are the effects; our main mistake in trading is to look for correlations. For example we try to get uptrending equity lines in-sample assuming that they will stay strong out-of-sample. This is mostly relying on the correlation of the pattern we try to reveal though indicators and the price. This assumption is simply wrong. Causation is not correlation. Did you ever wonder why lags work sometimes? Simple explanation: the cause occurs before the effect.

4. Avoid spurious causation by manipulations. The best systems are those which resist to data manipulations…


Patrick
very intriguing insights :)
do you have any experience with other artificial intelligence program?
like biocomp_profit8 or perhaps in conjunction with astro_trading like wave59?
just using some examples here because of their interesting platforms :rolleyes:
 
ghosts

1. Use entries#2 or a QPhase crossover as I said before (see bottom two curves); a threshold line is set so that no signal is generated.

2. Test at which level the signals occur; filter out the signals that look invalid. Entries#0 are perfect for building Bottom-Up systems which start with raw signals; it gives you the freedom to filter them out as you wish.

Noxa

What i understand from CSSA help Qphase does not have any extra filtering functionality above CSSA cycles, it introduces phase shift only.

Than finding the threshold to suppress those ghost orders is I think backward curve fitting procedure and there is no guarantee that when the market signal will change (like a change of slope of the line) this threshold value will hold. Or I'm mistaken with this ??

Krzysztof
 
lag does not depend of m-mistory ???

The CSSA-Trendline lags as each trendline does and there is no way around it if you don’t know the trend. The CSSA-Cycle however usually does not lag (see chart attached, bottom graph).

>> 1) Lag of CSSA is size of observation window (M-history)

This is not correct. The CSSA-Trendline lag depends on how many and what components are being used in the group. The more components in the group, the less lag; ultimately, when all components are used, price is fully reconstructed with no lag. As you can see in the chart attached, the CSSA-Trendline (red curve) lags the Cycle by about 2 to 3 bars only in this configuration; certainly not 50 bars!

Noxa

lag does not depend of m-mistory ??? Strange, see screenshot below. The same signal,
two CSSA cycles one with m-history 50 another with 250. It's clear that 250 has bigger lag i.e. time when cycles will disapear from indicator output after disappearing from the signal.

For the readers. After change the signal, the proper output is a flat line of course but this output is delayed due to lag.

Krzysztof
 

Attachments

  • lag.JPG
    lag.JPG
    74.3 KB · Views: 383
Last edited:
Running out of arguments against CSSA?

What i understand from CSSA help Qphase does not have any extra filtering functionality above CSSA cycles, it introduces phase shift only.

Than finding the threshold to suppress those ghost orders is I think backward curve fitting procedure and there is no guarantee that when the market signal will change (like a change of slope of the line) this threshold value will hold. Or I'm mistaken with this ??

Krzysztof

I really don’t know what you are talking about!!!! It sounds that you are running out of constructive arguments against CSSA. QPhase has zero-crossings when Cycle is at a peak or a trough. To generate a short entry signal at a peak for example, QPhase has to cross above a median line. As you can see in the example attached, crossing above a median line allows filtering out multiple signals that would have been generated by entries#0 under excessive noise conditions. So, just pick the lines that work best in your system. I have no clue whatsoever as to why setting lines in a crossover-based system or setting a parameter for that matter is a form of backward curve fitting!! Please elaborate.

BTW the line can be anything you want other than just a flat line to adjust for market condition changes as you wish.

Noxa
 

Attachments

  • QPhase crossovers.gif
    QPhase crossovers.gif
    11.4 KB · Views: 471
I really don’t know what you are talking about!!!! It sounds that you are running out of constructive arguments against CSSA. QPhase has zero-crossings when Cycle is at a peak or a trough. To generate a short entry signal at a peak for example, QPhase has to cross above a median line. As you can see in the example attached, crossing above a median line allows filtering out multiple signals that would have been generated by entries#0 under excessive noise conditions. So, just pick the lines that work best in your system. I have no clue whatsoever as to why setting lines in a crossover-based system or setting a parameter for that matter is a form of backward curve fitting!! Please elaborate.

BTW the line can be anything you want other than just a flat line to adjust for market condition changes as you wish.

Noxa

What i want to say based on my understanding of this problem is based on post 254:

1. Use entries#2 or a QPhase crossover as I said before (see bottom two curves); a threshold line is set so that no signal is generated.

2. Test at which level the signals occur; filter out the signals that look invalid.
Entries#0 are perfect for building Bottom-Up systems which start with raw signals; it gives you the freedom to filter them out as you wish.

So

1) We have down trend and E0 are generating buy signals and this is a fault
because the small sine cycle is generated

2) To avoid this we find the threshold for QPhase which will filter out those entries.

but this solution don't fix fault but just covers it. It not generic solution,
just a patch for this certain case. So if the an amplitude of this sin will change because of whatever (like changing of slope of the line) we will have a faulty entries again ??? It was for me backward fitting.

Krzysztof
 
Top