Noxa indicators for Neuroshell

I'm not sure. I guess it depends what instrument we're talking and when.

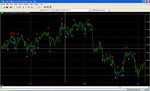
I mostly look at Forex and find it tends to zig-zag at tick to hour sort of time-frames and cycle at longer time-frames. By zig-zag I mean the price tends to rise (zig) bound below by a line of rising support until it breaks through it. The price will then fall (zag) bound above by a line of falling resistance until it breaks that etc. Typical trend-line sort of stuff.

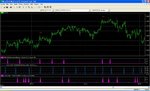
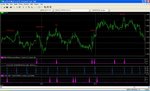
It’s worth noting that there is a fair degree of intraday automated trading on the FX markets by banks and hedge funds. I suspect that is what gives them this zig-zag behaviour. Then there is market news which makes things look more spikey and less cyclic. At a longer time-frame however it is likely to be driven by fundamentals (eg carry) which the market tends to react to in a cyclic fashion.
 
is FullSSA_normalise.mq4 a replica of noxa cssa cycle for MT4???

in this case, Noxa cssa is just a repainted Ergodic and shifted phase :

Picture :

mcadj5.jpg
 

Attachments

  • Ergodic.mq4
    3.1 KB · Views: 501
is FullSSA_normalise.mq4 a replica of noxa cssa cycle for MT4???

in this case, Noxa cssa is just a repainted Ergodic and shifted phase :

Picture :

mcadj5.jpg


I don’t think it is CSSA you are comparing Ergodic with. I use CSSA from Noxa in my trading and I can tell it does not repaint which makes it so attractive. It is a causal. To me you are looking at SSA which we know repaints the past.

Anyway, if this is true that FullSSA_normalise.mq4 is SSA, your Ergodic indicator is a lagging version of SSA which is interesting by itself. I am curious how much it would lag if you smooth it out to the same level of smoothness than SSA?
 
I have just spent the afternoon reading this post for the first time. My interest, like most others, is to put CSSA to good use. I have found some interesting items of discussion that will give me some things to think about. However, as with most things on the web, there is a high noise to information ratio on this thread, but there definitely some nuggets that I have gleamed.

I would like to suggest a modification to the artificial signals with noise generated by Krzysiaczek99 (see posts 75 and 93). I believe that a better test for CSSA would have been to combine a series of noise signals using different signal to noise levels as proposed in post 93 and then have an out of sample chunk of data merged with yet another noise level produce one set of data for tuning and out of sample testing. Inserting a trend into this data would be even better, btw.

I believe that Noxa's post #80 has the correct response to the problem at looking at just one noise level in a set of data -- CSSA will tune to the buried signal and the noise. I am not sure how any signal processing technique would be able to separate the noise from the data if using just one noise level. By including multiple samples for training with the signals buried, then I believe the probability greatly increases for finding the primary signals.

I do appreciate Kim Kim's feedback in posts 230, 231, 294, 296 and 300 in actually producing a useful test case, though Kim Kim indicated that over 100 charts were created and only a small handful proved useful. Included in some of the charts I am sure was the original learning curve of using CSSA.

Arryex has tried to formalize the process of tuning CSSA, though I don't think that actually happened in any post. Thanks for trying!

I'll update if I learn anything useful.

Hi,

Are you a DSP person ?? Any practical experience of using DSP methods in trading ??
I only know methods suggested by Ehler in his books and publications + Goertzel + using of FATLM/STLM and similar filers with MESA. Maybe you know some other methods

So far i didn't find those methods consistently profitable

Krzysztof
 
Krzysztof,

I've done some DSP, having studied vibration and acoustics many years ago. Like you I've read some books on DSP and cycles Hurst/Ehlers etc and used both MESA and CSSA but always found the hardest part is automating such an approach. It should be easy but it's not.

I do use MESA and CSSA for live trading but not in an automated fashion. I manually configure them for each market and bar (which is time consuming and hard to test the effectiveness of). I'm currently working on a solution to automate selection of a cycle rather than using manual configuration (similar to MESA_Period but more attuned to my visual fitting criteria - ie good fit with input curve and aligned highs/lows). I've modeled this in Excel and it looks favourable so far. Will keep the thread updated.

Stewart

According to this description you mix objective technical analysis (MESA, CSSA) with
non objective TA i.e. visual fitting criteria. So how do you measure predictive power
of this set up.

How you are sure than results are free of random results and data minig bias error ??

Krzysztof
 
Hi Krzysztof,

In short, I'm not. Visually fitting then stepping forward or trading 'seems' to work well but like you point out it is difficult to show metrics and have confidence in such a solution given it isn't mechanical (yet).

The automated approach I'm working on should be fully testable.

Stewart
 
hi guys i have been reading this forum for a while .. and started testing the noxa indocators ..however a bit of ambiguity stays in..pls find attached my pic i used a simple rules to predict 5 bars optimal sell close

there are three different sysmbols 1> red triangle 2> blue triangle for buy 3> a empty blue triangle.. i cant understand the meaning of empty blue triangle .is it the predicted 5 bar based ? and if so then how can i know whether its a sell or buy...

secondly i had some real trouble connecting to mt4 .. it says wait until metatreder connects to server but i checked and its already connected..

any help appreciated
 

Attachments

  • prediction.jpg
    prediction.jpg
    97 KB · Views: 636
Last edited:
here is my indicator which i created with a combination
1> noxa cssa short
i used 100,9,4,1,0,100,5000,0 as inputs .. i dont know what group start and group depth means! but i knew that noxa show range indcator showed me a range from12432to 100 bars so i selected a range from 100- 5000 bars to be trained

correct me if i was wrong because i only wanted the least amount of bars to be trained... to prevent overfitting of noxa indicators..

2&3 indcators are propritory indcators

when these 3 indicators coincide a powerfull sell signal arises .. when 2 of those indictators coincide with a +/- 1 bar lag/lead a sell warning arises check the pics
 

Attachments

  • 1.jpg
    1.jpg
    131.3 KB · Views: 471
  • 2.jpg
    2.jpg
    128.2 KB · Views: 449
Last edited:
Hi Chris,

I am a newbie to this forum but I happen to use the Noxa CSSA addon.

I found the indicators quite easy to understand and to handle (as in control). They are zero-lag indicators and do provide very accurate change points at any timescale!!! This is real as you can see in the chart example attached. But more surprising, I was able to identify cycles that persist and generalize very well out of sample!!! By the way the results attached are out of sample...

Truly impressive!!!

The best indicators for me so far.

P.Z

hi pz are you still onto noxa.. check my 2 posts if you have some spare time
 
Hi Amit,

I think PZ is one of developer guy (noxa)..you can guest after...

You should read carefully about using noxa parameter, if you take a wrong parameter your indicator may equal with a lead indicator (take future values). Which may not useful for a real trade.

regards,
Arry
 
CSSA does not look at the future but if you set the training range beyond today, it increases by one bar each time a new bar comes in thus triggering it to recalculate. You have to be careful at setting the training range so that TrainStart + TrainBars < number of bars in your chart.
 
CSSA does not look at the future but if you set the training range beyond today, it increases by one bar each time a new bar comes in thus triggering it to recalculate. You have to be careful at setting the training range so that TrainStart + TrainBars < number of bars in your chart.


yes thats what i have done TrainStart + TrainBars < number of bars .. i am getting some good results on eod.. after reading the forum i doubt this is gonna be same with real time data feed. right now i am testing on 1hr eur/usd trying to capture cycles wide as 250 =mhistories and 9grpstart 4 droup depth

i am mixing basic technical indicators and confirming the trades when i have sell/buy from noxa cycles ... but again this all is eod 1hr only

i had some problems with connecting mt4 datafeed as it said wait for neuroshell toconnect server

You should get similar results live but make sure that your test is done on out-of-sample data. In my trading, I confirm entries too but from several cycles. It’s all based on the cycles shifting to a larger time frame after a news release. Before a news release, I would be on a 5-minute cycle. After the release the cycle shifts to 15 minutes or even hourly. I use a neural net to tell me when the cycle has shifted. NeuroShell + CSSA is a good combination for that.
 
You should get similar results live but make sure that your test is done on out-of-sample data. In my trading, I confirm entries too but from several cycles. It’s all based on the cycles shifting to a larger time frame after a news release. Before a news release, I would be on a 5-minute cycle. After the release the cycle shifts to 15 minutes or even hourly. I use a neural net to tell me when the cycle has shifted. NeuroShell + CSSA is a good combination for that.

do you use noxa cssa as inputs for prediction of shift in cycles during optimisation phase.. or visually check it...
i am testing right now multiple neural net inputs for a close next bar predcition.. the inputs are technical patterns, noxa cssa and other instrument closes but i will have to wait for a bit as this is using up my compuetr power a lot even thou have 4 gb ram .. its quoting me 2 hours for trade predictions on 1 hour tf..(y)

also being a tech analyst i thing neuroshell chart patterns are not up to date ... for example their bear and bulll flags are not what i expected .. missing symettrical triangles etc ect .. most important i could not find trendlines which i could feed to neural nets...

i highly appreciate you feedback in early posts..
 
hi guys

has anyone of you created pivots in neuroshell. I used the intraday fundctions to calculate but seems some kinda error.

Basically i want to use daily pivot values for smaller timeframes.. any hep appreciated(y)
 
More than just:

"TrainStart + TrainBars < number of bars"

Instead:

"TrainStart + TrainBars < number of bars used for in-sample testing"

For example if your chart has 1000 bars and you are using the last 500 bars for out-of-sample then you may wish to use TrainStart = 1 and TrainBars = 500. This will ensure that bars 501 onward are completely blind.

Be careful that the results will change as you add more historical dates to your chart.

Perhaps post a chart of your CSSA 9/4 for hourly EUR/USD. I've actually been looking at something very similar of late. Are you using a Trading Strategy or a Prediction?
 
More than just:

"TrainStart + TrainBars < number of bars"

Instead:

"TrainStart + TrainBars < number of bars used for in-sample testing"

For example if your chart has 1000 bars and you are using the last 500 bars for out-of-sample then you may wish to use TrainStart = 1 and TrainBars = 500. This will ensure that bars 501 onward are completely blind.

Be careful that the results will change as you add more historical dates to your chart.


Perhaps post a chart of your CSSA 9/4 for hourly EUR/USD. I've actually been looking at something very similar of late. Are you using a Trading Strategy or a Prediction?

windsurfing look at my post 331 i got 2 charts up 1 hr eurusd.. this are just indicators . I havent used them as strategy as my neuroshell keeps crashing ..so sooner or later will do
 
Top