Joules MM1
Established member
- Messages
- 648
- Likes
- 142
Any views on the November price?
There appears to be a general view (media et al) of crude backing off its parabolic ride.
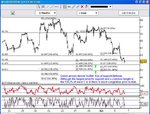
A large correction appears to me to be near an end and presents an opportunity to go long crude.
Below the current price (as I type 6211US/bbl) there appears a cluster of support at 61.56-61.68 and not much else below that.
The challenge for the bullish pit crew is for a buying spree to ignite, pre-media hype, followed by strong upward break-out from this area. What is vital is for the upward impulsive pattern to ensue, BEFORE any cyclic external cause, as an intrinsic buying rush is much more stable than a whipping, news induced, spike, as we saw yesterday when the media report (a pathetic attempt to push up the market by the pit bulls) saw the price make .60 whip only to be fully retraced.
To capture the best part of the move the long position just above 61.56-61.68 with a stop just below as any news induced spike, once that low is established, will likely miss the low.
The nearby Fibonacci cluster of support (or resistance if you prefer short) meets several pattern relationships and the downward momentum is much lower relative to the top 22/09/05 and this comined with the general lack of angst in the media points towards (at the minimum) a low being established just below 6200 to 6156.
Crude has for a long time endeared (as most commodities do) its price extremes towards Fibonacci ratio. I think we are about to see a bottom inplace.
======================================================================
Addendum:
I neglected to mention that a common wave relationship of A to C is 138.2% and this wouldmake a triple cluster of support at 60.90/bbl
Attachments
Last edited:

