Newbie Spread Traders Journal

danboi8989

Member
Messages
63
Likes
2
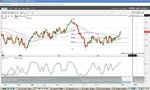
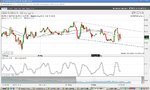
OK, so thanks to the advice of many I've decided to keep a journal of each trading day. I will indicate in as much detail as possible my entry and exit points for each trade, how long i am in the trade and my reasons behind the three of these. By doing this i am hoping to be able to keep a record of where i may be going wrong or right, which trading methods are working best for me and eventually analyze this data to help create a good solid consistent trading system.

I am not a complete newbie to spread trading i have been studying technical analysis part time for around three years now as well as studying business at college and keeping a full time job. I have spread traded many times before sometimes successful sometimes not so successful. My full time job is now over and i will have the time to really step it up a gear with my trading.

I have demo accounts open with Trade Fair and CMC Markets which i am going to use to use to place my trades. Since i am now not currently employed i will not carry on this learning curve trading with real money. I understand the psychological differences involved when trading real money but this is not an option at the minute. I can however make sure i stick to the same risk management plan used when trading real money and make sure I never risk more than 2% of my over all bank balance (the 2 accounts combined). My start up cash will be 20,000 (10K in each account). The reason i am using two different brokers is that individually they don't cover some of the instruments i may wish to trade however between them cover the majority of stocks that can be traded. Also CMC Markets comes with an android app making it easy to access my trades when i am out and about. Also the spread is sometimes tighter on one than the other.

Most importantly of all i would appreciate ANY constructive feedback and suggestions that you readers can give me. I wish in years to come that i am able to trade consistently for a living and i am taking this as serious as possible. Please feel free to leave your comments.
 
OK, so my feeling on the UK Market today are that it may struggle to rise significantly as the FTSE100 is nearing a strong daily resistance point of around 5880. For the last 11 days it has been ranging between this and about 5790. Weighed down by various European debt troubles and other political factors I believe it will continue to range or possibly fall. I will approach any potential LONG trades with extreme caution. This is just my prediction for today's over all market. I will post later any trades entered or any potential trades spotted.
 
Thanks Aspiring trader.

I have just entered a SHORT trade at £1 per point in Facebook. I wont go into the specifics the system needs because i will be here all day. But basically i use three MA indicators that must all be relatively parallel to each other in an upwards or downwards direction in order for me to consider trading that particular trend up or down. my entry and exit points are based on other things such as S/R or trend line breaks etc. I use anything up from the 1 hour time frame in order to find potential trades but use the smaller time frames to time my entry and exit points.

Anyway.. From a technical POV the one hour chart is showing a strong down trend on Facebook. This price has recently broken below previous support. Using the 15 minute time frame i have timed my entry by trying to define the top of a small retracement upwards in order to try for the best price.

News also reports that Facebooks first big investor Peter Thiel has cashed out. The price reacted negatively to this and i believe more people are soon to follow, giving the stock in my opinion more downside potential.

Entry Price - 19.52

Stop Loss - 20.60 (108 Points)
 

Attachments

  • facebook 21 08 12.jpg
    facebook 21 08 12.jpg
    142.9 KB · Views: 296
NOTE: My entry point was not brilliant on this one. I think from now on always wait for any recent gaps to close before making the trade. (providing they are not in my favored direction)
 
The second trade i have entered for the day is LONG on Apple £0.20. I have entered this trade because technically Apple is showing a very strong up trend in most time frames. Due to some positive news the stock opened sharply up creating a gap. I have timed my entry based on the closing of the gap. I believe once this had been closed there is potential for further upwards movement.

Entry - 664.12 @ 20p a point

Stop Loss - 658.50 - £112 away - 562 pips away
 

Attachments

  • apple 21 08 12.jpg
    apple 21 08 12.jpg
    128.2 KB · Views: 233
Stopped out of Apple at a loss of £117.80. The stock very quickly continued to plummet. Maybe the stop loss on this one was set a little too close. I will re review at the close of the US trading day to try and define what went wrong. Until then any feedback would be greatly appreciated.
 
Summary of trades

Total trades 2 - 1 still open - 1 closed at total loss of 117.80 for the day.

Facebook trade is currently £33 in profit

The Apple trade was just bad judgement. I will not base my trades on a gaps closing in future. However i should re look at Apple tomorrow as now its looking promising according to my trend following system. It has retraced nicely back to the 1st moving average. I must 1st wait for a positive signal and possibly enter another long trade. Also remember Apple is quite volatile and heavily traded i should not set my stop loss so close as to get wiped out within minutes of entering the trade.

However my judgement of the over all market sentiment was not wrong the FTSE is currently trading down along with various other US indeces
 

Attachments

  • apple 21 08 12.jpg
    apple 21 08 12.jpg
    132.5 KB · Views: 234
FTSE 100 looks again today like it could be heading down. New recent lows in the one hour time frame suggest possible downside movement, however a couple of encouraging news reports could always change that. I will re look at apple again later today as yesterday it ended the day looking like a potential LONG trade for my trend following system. AGAIN i will have to be careful when entering long because the market could be against that today.
 
This chart for the 1 hour EUR/USD could be a possible set up. Must wait for the buy signal 1st. A break out of its consolidation to the upside would be a nice entry point.
 

Attachments

  • eur usd 22 08 12.jpg
    eur usd 22 08 12.jpg
    137.8 KB · Views: 192
I need to read up more on setting target prices and using Fibonacci. If anyone knows any good internet sources to help me out with this i would be very appreciative
 
I have entered LONG on the EUR USD trade at 1.24770 at £4 a point. The price broke through the consolidation and i times my entry based on that it would now continue its rise.

I have set my stop loss at the s/r level of 1.24470
MY TARGET IS FOR AT LEAST 2:1 RISK REWARD RATIO FOR ALL TRADES
 

Attachments

  • eur usd 22 08 12.jpg
    eur usd 22 08 12.jpg
    129.6 KB · Views: 214
Ok so today i was stopped out of the EUR USD trade for a loss of £120.00... I think this again was due to my stop loss being too tight. I shoudl have lowered the stakes from £4 a point to £2 a point and given a little bit of wriggle room for the price. My initial prediction was correct and price moved how i wanted it to. I just wasnt in the trade because my stop loss was too close. All part of the learning curve!! :smart:

Trade summary

1 trade closed - 1 trade still open

loss = £120

Facebook trade closed at break even point. Hopefully more downside movement tomorrow.

My feeling on the market going down today also correct... FTSE 100 closed 83 points down...
 

Attachments

  • eur usd 22 08 12.jpg
    eur usd 22 08 12.jpg
    128 KB · Views: 191
NOTE : AUS/USD hourly time frame has hit a nice resistance point... i need to check this out in the morning... could be a nice set up on the down side
 
Thanks Aspiring Trader very useful!

I've pretty much spent most of today studying this video and many others like it.. My morning thoughts on the UK market where bearish again... I've placed 2 trades that are currently still open along with the Facebook trade from 2 days ago that's still hovering around break even.

1st trade - FTSE100 - 1 pound a point SHORT from 5791 at 9.03am... i took the trade because my views on the UK market are very bearish for the time being and also it fitted in nicely with my trend following system. Price had previously rebounded off the 50 day MA.

2nd trade - GBP USD - £2 a point - Over all trend looked positive on the LONG side. Price had been consolidating for a while (1 hour time frame). I took the trend when the price hit the bottom of the rectangle it had been consolidating in using the 15 minute time frame. Here i am hoping for at least a bounce to the upper end of the rectangle if not break through it for longer term gains When price hits the top of the rectangle i will sell half the position for a small profit to cover any losses that may occur if price rebounds and breaks to the downside.
 

Attachments

  • gbp usd 23 08 12.jpg
    gbp usd 23 08 12.jpg
    144 KB · Views: 167
  • uk100 23 08 12.jpg
    uk100 23 08 12.jpg
    136.5 KB · Views: 178
Ok so i got out of the GBP USD trade at a very small profit. This is because i spotted something using Fibonnaci on the daily time frame. The price had just hit the 61.8 retracement and bearish signals from the stochastic being over bought also signaled a possible reversal. As most know signals on larger time frames are more significant than signals on smaller time frames. So basically the signals given from the daily were likely to effect what happened on the hourly time frame. Even if it did look bullish. NOTE: Make sure to check larger time frames before entering a trade. School boy error
 

Attachments

  • gbp usd daily 23 08 12.jpg
    gbp usd daily 23 08 12.jpg
    147.9 KB · Views: 177
My feelings again today are bearish for the FTSE100... Daily there is still room for downwards movement before hitting any support and the 4h and 1h time frames just show downwards trend continuing. My FTSE100 index trade was 25 points in my favor this morning so i am going to set my stop loss to zero. Just to make sure my gains don't turn into a loss. Facebook does not seem to be moving and is till hovering around break even on its close last night. I need to perhaps review this chart in case of any support i have missed on the larger time frames that could cause me problems.
 
Stopped out of the FTSE trade at break even. Maybe i should not have tampered with the stop mid trade or i need to learn more about placing stops. Anyway more learning over the bank holiday weekend and go again Tuesday
 
Back to Trading after the bank holiday weekend! Bearish outlook for the FTSE100 again but its trying to find a good entry point that's the problem. The only thing i can see from the 15min time frame is a bit of channel forming downwards where price action is bouncing from top to bottom. Maybe i will try to find an entry based on this today, to go for a SHORT trade.

My facebook trade us currently 37 points up. I will not tamper with the stop loss unless it reaches at least 100 points profit.

Bit dry today in picking trades, think im going to have to just go away read up on some stuff n come back to these later (keeping an eye on the potential ftse trade of course)
 

Attachments

  • ftse100 28 08 12.jpg
    ftse100 28 08 12.jpg
    142.6 KB · Views: 193
Top