sallyjc1975
Junior member
- Messages
- 14
- Likes
- 1
Hi
Hello this is my first post. Perhaps a short introduction to show where I am coming from and I would be grateful for any advice plus an answer to my charting question please! Apologies in advance for the Chapter & Verse.
After watching the recent BBC programme on Day Trading I wish to see whether I can make some pocket money from trading the financial markets. I can hear the collective groans as I type this but I would like to try all the same! From my research I think the following strategy may suit me:
Trade the Dow during it's afternoon session.
Attempt to grab 10 points a day
Spreadbet broker
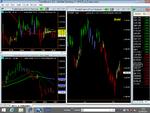
I have opened a demo Spreadbetting account and have been comparing their live Dow price against the 1min chart on Livecharts.co.uk which I assume is a live cash price? Can anyone confirm?
Initial observations are that the the SB price moves all over the place, relative to the Livecharts price, and it seems generally to be 2pts away. The SB price really moves around as the Livecharts price reverses direction, no doubt trying to trap customers. Also the SB price anticipates the Livecharts price reversals (1min candles) by a second or so. I assume this is because the SB price watches the futures price? That said, and even though I don't intend to pay for a live futures price, I see my trading model as viable, i.e grabbing 10 points a dayusing Livecharts as my main chart.
I have been trading a demo account and am making money. My rules are pretty basic, entries (long or short) are based on simple S/R, with trend lines/channels drawn from simple pitchforks. I also note pivot points just in case they are near my entry/exit levels. My risk reward is 1:1 and I use a stop loss. The big test is whether I will be profitable when I move to real money. I don't intend to use guaranteed stops as they cost an extra 2pts but I will mitigate my risk by not being in the market for long and not trading during big economic announcements. Since I am not attempting to become a millionaire I think/hope I will have the correct psychology and will (a) switch off the laptop when I hit my 10pt target and (b) stop trading altogether after 2 consecutive losses. Depending on how I do it might be better to reduce my target to 9pts. Anyway that's probably enough for now! I would be grateful for any comments as to whether my strategy is viable.
On to my question. I would like a free charting package with past data so I can check how the strategy works. I see NinjaTrader mentioned a lot so I would like to try this. I am working on the assumption that if Professional traders are using it to actually trade with, it's charting functions will be enough for me. Livecharts is great for giving me a live price but not really suited to easily analysing past data. Will Ninjatrader together with past data allow me to look at 1min and 5min candles on the Dow? Also I would like a program I can install on a PC rather than over the web.
Thanks for any help!
Sally
Hello this is my first post. Perhaps a short introduction to show where I am coming from and I would be grateful for any advice plus an answer to my charting question please! Apologies in advance for the Chapter & Verse.
After watching the recent BBC programme on Day Trading I wish to see whether I can make some pocket money from trading the financial markets. I can hear the collective groans as I type this but I would like to try all the same! From my research I think the following strategy may suit me:
Trade the Dow during it's afternoon session.
Attempt to grab 10 points a day
Spreadbet broker
I have opened a demo Spreadbetting account and have been comparing their live Dow price against the 1min chart on Livecharts.co.uk which I assume is a live cash price? Can anyone confirm?
Initial observations are that the the SB price moves all over the place, relative to the Livecharts price, and it seems generally to be 2pts away. The SB price really moves around as the Livecharts price reverses direction, no doubt trying to trap customers. Also the SB price anticipates the Livecharts price reversals (1min candles) by a second or so. I assume this is because the SB price watches the futures price? That said, and even though I don't intend to pay for a live futures price, I see my trading model as viable, i.e grabbing 10 points a dayusing Livecharts as my main chart.
I have been trading a demo account and am making money. My rules are pretty basic, entries (long or short) are based on simple S/R, with trend lines/channels drawn from simple pitchforks. I also note pivot points just in case they are near my entry/exit levels. My risk reward is 1:1 and I use a stop loss. The big test is whether I will be profitable when I move to real money. I don't intend to use guaranteed stops as they cost an extra 2pts but I will mitigate my risk by not being in the market for long and not trading during big economic announcements. Since I am not attempting to become a millionaire I think/hope I will have the correct psychology and will (a) switch off the laptop when I hit my 10pt target and (b) stop trading altogether after 2 consecutive losses. Depending on how I do it might be better to reduce my target to 9pts. Anyway that's probably enough for now! I would be grateful for any comments as to whether my strategy is viable.
On to my question. I would like a free charting package with past data so I can check how the strategy works. I see NinjaTrader mentioned a lot so I would like to try this. I am working on the assumption that if Professional traders are using it to actually trade with, it's charting functions will be enough for me. Livecharts is great for giving me a live price but not really suited to easily analysing past data. Will Ninjatrader together with past data allow me to look at 1min and 5min candles on the Dow? Also I would like a program I can install on a PC rather than over the web.
Thanks for any help!
Sally