Neuroshell Trader

It is excellent to find a people talk about NST

How can i get ART in NST

How can i build a digital strategy in NST
I found a good relation between the index UK100 (London stock market index and found in some broker's MT4 platform) and GBPUSD, can i combine the two issues in one chart ? or one startegy ???How ??


Thank you in advance

First, you must find a way to feed NST with real time data. You can subscribe eSignal or any other data provider.

Once you have data feed, follow these steps:

1. Click Insert > Other Instrument Data
2. Choose instrument type, in this case I choose Forex data
3. Click as many instrument you want to display on one chart. In this example I first create GBPJPY 15 minutes chart, then insert EURUSD, GBPUSD and USDJPY data. Note that you can only use ONE timeframe on one chart. It is possible though, using another add-on, display different timeframe on one chart.
4. Select data type to display. I choose Open/High/Low/Close
5. Multiple forex pairs are displayed on one chart. The green chart is the base chart (GBPJPY data). The red bars indicate incoming real time data.

If you want to make GBPUSD prediction using UK100 data as an input, then you must display the UK100 data on one chart like this.
 

Attachments

  • screen1.jpg
    screen1.jpg
    21.6 KB · Views: 382
  • screen2.jpg
    screen2.jpg
    21.4 KB · Views: 625
  • screen3.jpg
    screen3.jpg
    34.9 KB · Views: 401
  • screen4.jpg
    screen4.jpg
    17.4 KB · Views: 428
  • screen5.jpg
    screen5.jpg
    112 KB · Views: 915
Have you tried DDE? Also, if you google for instructions on the MT4 Feed, I'm sure there's a .doc / .pdf somewhere floating around - I remember seeing it.

Also, if that's the only thing you don't know how to do, do you know these 2 following things:

1) How do I make the out of sample (green) area? And what's the difference between this and paper trading?

2) How do I incorporate ATR? I can't seem to find this indicator for trailing stop.

Thanks

DDE does not store historical data in your computer. It means if you want to create a chart with one week data, you must collect the data by keeping your computer up and running for one week.

Click on the upper menu: Tools > Options. Then check the option "Allow real trading to begin before last chart date" in the Advanced tab. Then in Trading Strategy or Prediction wizard you will see new option "Start trading before last chart date".

Read help menu for descriptions about the difference between Paper Trading and out of sample trading.
 

Attachments

  • screen6.jpg
    screen6.jpg
    27.3 KB · Views: 475
  • screen7.jpg
    screen7.jpg
    28.3 KB · Views: 2,311
Order executions in NST are done after bar completion. There is no other way to do execution inside a bar. This also applies to trailing stops. Trailing stops move after one bar is completed. If you want to make trail stops based on indicator then you create a rule, for example: IF close < ATR then Close Buy Long etc.
 

Attachments

  • screen8.jpg
    screen8.jpg
    113.1 KB · Views: 1,151
Just as a matter of interest to a non owner of NST please could someone post some results for the S&P 500 for instance ? Things like win/loss ratio etc. on last 18 months
thx
 
Just as a matter of interest to a non owner of NST please could someone post some results for the S&P 500 for instance ? Things like win/loss ratio etc. on last 18 months
thx

Give me 36 month data in the .csv format with the following column sequence: Date, Time, Open, High, Low, Close, Volume

I never try S&P500 before. If you can provide the data I will create a strategy with 18 months out of sample trading.
 
Give me 36 month data in the .csv format with the following column sequence: Date, Time, Open, High, Low, Close, Volume

I never try S&P500 before. If you can provide the data I will create a strategy with 18 months out of sample trading.

Hi kim,
The above data can be downloaded from yahoo into excel and then saved as a csv file

here are some stats from Biocomp profit

Trade Count: 26
Winning Trades: 24 (92.31%)
Losing Trades: 2 (7.69%)
Cumulative Winners: 248.8976
Cumulative Losers: -7.9474
Average Winner: 10.3707
Average Loser: -3.9737
Highest Trade: 26.3410
Lowest Trade: -4.4264
Ave Trade (Expectancy) 9.2673
Bars Long: 434
Bars Short: 335
% in Position: 93.21%
Trade Stdev: 8.6650
Win/Loss Point Ratio: 31.3181

Max Drawdown: 51.5000
Bars Duration: 91
Time Duration: 128
Max DD Date Start: 13/01/1903
Max DD Date End: 21/05/1903
Max DD %: 37.57%

Open Equity: 0.0000
Closed Equity: 240.9502
Total Equity: 240.9502
Net Equity: 240.9502
Minimum Equity: -1.3000
Buy-n-Hold Equity: -32.5000
1st Signal Buy-n-Hold: -36.7000
Equity straightness: 0.9175
% of Perfect: 11.21%
% of Perfect: 11.93% (while in a position)
% Direction Correct: 52.54%
Trade Ave % Return: 1.11% (Accum. trade % returns / Nbr Trades)

The figures used for the above were the 10 minute S&P figures on intraday. I input them manually, hence the strange dates of 1903
 
Last edited:
Read help menu for descriptions about the difference between Paper Trading and out of sample trading.

Ok. Here's what I understand:

Normally, the program optimizes over the sample data, and then the green is to evaluate that optimization settings over an out of sample data. Paper trading, however, is already out of sample, but we are optimizing over the sample (non-brown) area.

What I get from this is that with paper trading, we're looking at the equity curve of the sample data (to see whether it's smooth, etc). And with out of sample (green), we're looking at the out of sample data.

The help file says this is because it "seems to be the standard among competitors". I do not understand why we have both options - why can't we just use the green/brown?

Is there anything else I am missing that you can point out?
 
Have you tried DDE? Also, if you google for instructions on the MT4 Feed, I'm sure there's a .doc / .pdf somewhere floating around - I remember seeing it.

Also, if that's the only thing you don't know how to do, do you know these 2 following things:

1) How do I make the out of sample (green) area? And what's the difference between this and paper trading?

2) How do I incorporate ATR? I can't seem to find this indicator for trailing stop.

Thanks

Thanks Skyhr,

I looked in to it a bit and I think you are right about DDE. Thanks!!!

In regards to ATR, I did a little research and to the best of my knowledge it is not a built in indicator. You can get it as an Advanced Indicator Set add-on. but I was able to find out how to create it using the new indicator wizard. (see attached file)

As for the out of sample (green) area, If I am understanding the question. When you are in the prediction parameter dialogue box, Choose "Start trading before last chart date".

The difference between the trading range (green area) and paper trading is that neuroshell is programed to look at the trading range like its seeing it for the first time.

The paper trading section is what neuroshell uses to see which strategies it learned from optimization works best.

It uses it's optimizations and training from the previous sections to make predictions on the trading range. Its kind of a virtual forward test.

baneya.
 

Attachments

  • NeuroShell Trader formulas.doc
    42.5 KB · Views: 3,005
As for the out of sample (green) area, If I am understanding the question. When you are in the prediction parameter dialogue box, Choose "Start trading before last chart date".

The difference between the trading range (green area) and paper trading is that neuroshell is programed to look at the trading range like its seeing it for the first time.

The paper trading section is what neuroshell uses to see which strategies it learned from optimization works best.

It uses it's optimizations and training from the previous sections to make predictions on the trading range. Its kind of a virtual forward test.

baneya.

Hi Baneya,

Thanks for the response. I am still a little confused as to the details of paper trading. I understand the "trading section" well though now, thanks. So, with paper trading, NST makes several optimizations on the sample data then sees which optimization works best on the paper trading part?

But then how does this become a "virtual forward test." I understand how the green part can be a "virtual forward test" because we're evaluating the optimization.

How do we evaluate the paper trading - we should look at the equity curve of both the out of sample and sample data, yes? (and this applies to the green evaluation, too?)

That's my understanding of it anyway. The virtual forward test applies only to the trading portion.

As for the Paper trading part... To the best of my knowledge being able to evaluate the optimization and paper trading ranges in NST is not possible. I could be wrong. I'm no expert on NST but I don't think its possible.
 
Ah ok.

Hey, Kimkim and Pat, do you guys know what the purpose of paper trading is? Isn't to evaluate optimization, but isn't that why we have the out of sample evaluation (green)?
 
Ah ok.

Hey, Kimkim and Pat, do you guys know what the purpose of paper trading is? Isn't to evaluate optimization, but isn't that why we have the out of sample evaluation (green)?

Paper trading is a very important part of the learning curve imho. Fraid i don't know hardly anything tho about NST.

Here are some stats from my Biocomp Dakota swarm system to compare things

Trade Count: 1344
Winning Trades: 903 (67.19%)
Losing Trades: 441 (32.81%)
Cumulative Winners: 9389.0556
Cumulative Losers: -6511.0533
Average Winner: 10.3976
Average Loser: -14.7643
Highest Trade: 102.1832
Lowest Trade: -158.7468
Ave Trade (Expectancy) 2.1414
Bars Long: 1167
Bars Short: 1205
% in Position: 100.00%
Trade Stdev: 16.9908
Win/Loss Point Ratio: 1.4420

Max Drawdown: 305.5324
Bars Duration: 158
Time Duration: 227
Max DD Date Start: 22/02/2000
Max DD Date End: 06/10/2000
Max DD %: 323.38%

Open Equity: -1.3000
Closed Equity: 2878.0023
Total Equity: 2876.7023
Net Equity: 2876.7023
Minimum Equity: -211.0515
Buy-n-Hold Equity: -509.0200
1st Signal Buy-n-Hold: -518.9500
Equity straightness: 0.7987
% of Perfect: 11.29%
% of Perfect: 11.36% (while in a position)
% Direction Correct: 53.96%
Trade Ave % Return: 0.19% (Accum. trade % returns / Nbr Trades)

Wow, it looks like your system is great! Could you elaborate on the steps you personally take to develop systems? Especially, any part with evaluating optimization, or using paper trading. Any help on how to implement walk forward NN would be huge as well because I am confused as to whether the normal NN are walk forward or not (are they?)

Ah, also. I've heard something about particle swarm optimization - is this related to your system you just mentioned? If so, what is it and how would I implement this?

Thanks!
 
From a neural network point of view here are my stats up to present day

Trading Start Date: 11/11/2007
Trading Stop Date: 17/06/2009
Number of winning trades: 43
Number of losing trades: 26
Percent winning trades: 62.32%
Highest trade value: 206.10
Lowest trade value: -49.30
Average trade value: 22.9942
Std Dev of trade value: 51.6031
Ave period between trades: 7.49
Lowest Acct Equity: 31.20
Max. Intraday Drawdown: -84.00
Total Equity / Max. Drawdown: 18.4655
Equity Straightness: 0.8809
Closed Equity: 1,586.60
Open Equity: -35.50

Perfect profit: 7,031.40
Maximum 'desired' profit: 3,322.80 (47.26% of perfect)
Model's Profit: 1,551.10 (22.06% of perfect, 46.68% of 'desired')

Percent of Buy-N-Hold: 393.27%
Significance: 538.

I am hoping someone with Neuroshell will post their similiar period stats for comparison.
 
Paper trading is a very important part of the learning curve imho. Fraid i don't know hardly anything tho about NST.

Here are some stats from my Biocomp Dakota swarm system to compare things

Average Winner: 10.3976
Average Loser: -14.7643

Ave Trade (Expectancy) 2.1414

% in Position: 100.00%

Win/Loss Point Ratio: 1.4420

Max DD Date Start: 22/02/2000
Max DD Date End: 06/10/2000
Max DD %: 323.38%

I have some comments for you Pat:

(1) Ave Trade is NOT equal to expectancy.

(2) Win/Loss Point Ratio: 1.4420. If

Average Winner: 10.3976
Average Loser: -14.7643

Then the win loss ratio is: 0.704, NOT 1.4420. They mean the profit factor probably but confuse the two.

(3) % in Position: 100.00%


Is this system always in the market?

(4) Drawdown that lasted for almost 4 months and equal to 323.38%


This is supposed to be a joke right? This system is probably based on an optimized MA crossover and a stop-n-reverse strategy.
 
Last edited:
I have some comments for you Pat:

(1) Ave Trade is NOT equal to expectancy.

(2) Win/Loss Point Ratio: 1.4420. If

Average Winner: 10.3976
Average Loser: -14.7643

Then the win loss ratio is: 0.704, NOT 1.4420. They mean the profit factor probably but confuse the two.

(3) % in Position: 100.00%


Is this system always in the market?

(4) Drawdown that lasted for almost 4 months and equal to 323.38%


This is supposed to be a joke right? This system is probably based on an optimized MA crossover and a stop-n-reverse strategy.

1. dunno
2.maybe total profits/total losses ?
3.always in market
4.It takes a while to get going. Start date 3/1/2000

For the full definative answer you might like to contact the vendor ( I'm only a customer ) :innocent:

Rather than purchasing system after system I think it would be VERY helpful if members would post stats from different programmes to compare them. This is the S&P 500 EOD
 
Sorry, quick question:

I know I'm supposed to do something to include the built in signals into the TS - because I can't seem to include them right now. What am I supposed to do again?
 
Anybody can help me?

How can I display "Range Bars" Chart on Neuroshell with datafeed from MTFeedPro? It seems not working, even with real time ticks.

In the display it writes "No Data is available for Close". Other chart types (seconds, minutes, ticks, volumes etc) are working normally, just this "Range Bars" chart don't work.
 
Just a question about Neuroshell

I am total new with Neuroshell and I've a big problem: I cannot make a prediction for the future; the prediction is always made to the input data, no output data has never been generated, I've tried and tried, but nothing, can you help me please? thanks

Hi,
I am not new with this software, but not expert as well. I will share some known idea using this software and having some feedback from you or other NS (Neuroshell) users.
My tips for all new users:
1. Study it first. Strongly advised to start with the Tutorial and the video accompanied from your NS CD and study from the available example.
- With the tutorial (on Help Menu) you will know the concept of NS which combine the traditional and AI technique, for traditional, for example, you can define a trading strategy using MACD, NS will find for you what is the best setting for MACD cross over, and you can verify the result by optimization/back testing on your data. With AI, NS used genetic algorithm to find best setting for your MACD parameter.
- Study the video, start form help menu, but if you can access directly from Help menu you should insert your CD. Other method is you can copy all CD tutorial on your hard disk and call it directly, example you can put them in folder C:\NeuroShell Trader 5\Video\, run Getting Started.exe to show getting started video otherwise you can call directly Getting Started.avi if you have an avi movie player. NS using camplay to show the video.
- Study the example, with my NSDT I have 25 example chart, Go to Menu File, Open, C:\Neuroshell trader 5\Charts\.
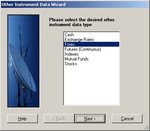
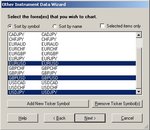
2. You should know how to prepare the data for your NS, NS can be feed by some data vendor such as eSignal, IQfeed, etc, broker data feed (such as Interactive Broker), or free data Yahoo finance (for stock), free ASCII data (example, you can import csv from Metatrader if you trade forex).
3. Define your Trading area: Stock, future, forex, your selection to be a starting point prior subscribe the data. With NS version you have you can select end of day data or real time data. If you have NS Trader or NS Trader Pro you need only end of day data then you can choose Yahoo data for free, using esignal/Iqfeed data for this version is less benefit ( think, minimum you paid $95) except you want to get some other data (such as fundamental, etc) to be integrated n your trading strategy. If you have NS day trader and you you would like to trade intra day then you need real time data feeding.
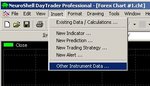
4. Start with Data import, example using Metatrader on forex. If you need I can give sample how to import it to NST.
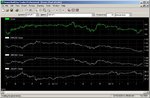
5. If you success to display ASCII data on your chart, Start inserting indicator on your chart. NS have a lot of indicators that can help you to analyze your chart.
6. Start to build your trading strategy, you can found with your data what is the best setup using traditional indicator, for example MACD cross over, RSI, CCI, etc. You can analyze what is the best parameter, profit, winning, losing, etc. We can discuss further if you need.
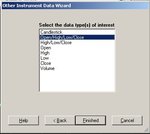
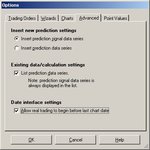
7. Start to build a prediction. With prediction, you can ask NS to predict future Open, Close price or its %Change, etc. You can make a prediction with input from your price data (O, H, L,C) or some indicators (RSI, MACD, Stochastic, etc), the output prediction can be next 3 day Open, etc.
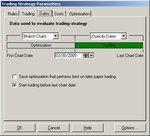
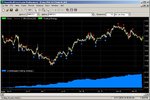
8. Analyze your trading strategy or prediction.
9. Discuss with some other users, post the question to NS support if you need their assistance.

I have seen some thread discussing about NS, hope this will be a starting point for good discussion. We can post some charts for our further discussion.
 
Hi, I'm total new with Neuroshell, I use it from 2 weeks and I have a Big problem: I cannot make any kind of 'output' data, I make the prediction (I've made a lot and a lot), but the result is always a prediction on the same Input data (the last N days of the Input data), No prediction for the future data. Anyone can help me? what's wrong?

thanks

Alex
 
Top