My trading

Ok here is the update for today. Please have a close luck to the open Positions I adjusted the stops for DAN and ZC.
 

Attachments

  • TRADE OVERVIEW.xls
    36 KB · Views: 306
Ok I want to describe my trading a little bit more. First of all I trade for a living and that makes me pretty risk averse. I always test the market and if the market does not do what I want I will be out with a small gain or a small loss. First of all I want to explain my excel sheet a little bit more.

nice - and real pro approach (y)

N
 
Please have a close look there are quiet some changes. I forgot to enter the stop for CDNS 12.45
 

Attachments

  • TRADE OVERVIEW.xls
    44 KB · Views: 181
Last edited:
Ok today I want to talk a little bit more about my trading, so that it will be easier to understand for you.

First of all I am trading for a living for 10 years now and for me capital preservation is the most important factor. Without capital I cannot trade and I cannot make money.

That is the reason why I am talking about my Risk- and Money management today. I will talk about my entries later, because they are far less important than my Risk and Money management.

During the last 10 years my hit rates is on average 62% of course it is higher or lower from time to time.

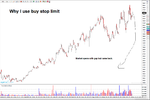
Due to the fact that I don’t have any magic indicator and that I cannot predict the markets I do not know which trade will work out for me and which one won’t. That is the reason I am entering most of the time with ¾ or ½ of the risk my first position.

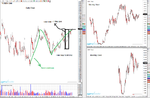
For example HP my Buy Stop Limit was 53.10 USD and my initial stop was 48.80 USD. Let’s assume we have a 250 K account and we want to risk 1.5% per trade. This means 1 risk unit for me is 1.5% for another trader 1 risk unit could be 2% etc.

Unfortunately I forgot to post this column so far that is the reason why I improved the excel sheet with this column. For HP my risk unit was ¾ instead of 1 because most of the times I want to test the market first.

Remember my goal is capital preservation that is the reason I am acting very cautious.

No let us do the math:

1.5% of 250 K = 3750 USD = 1 Risk Unit
No let’s check out the HP trade where I only used ¾ of 1 Risk Unit.
¾ Risk Unit = 2812.50 USD that is the amount I am willing to lose with the HP trade.

Now let’s calculate how many shares we can buy.

Entry: 53.10 USD; Stop: 48.80 USD; Risk 4.30 USD

This means I can buy (2812.50 USD / 4.30 USD) shares (654)

IMPORTANT: Do not forget to calculate the transaction fees, because they will add up over one year. I always calculate 1 cent per share, but if you compare brokers you can find flat rate deals with 9.99 USD for 5000 shares. It always depends on your Portfolio size. Always try to find the best deal, because it is hard enough to make money in the markets but it is much easier to save some money to boost the performance. Just do some calculations what amount of money you can save over 10 years.

I will try to do more and more explanations about my trading. If you have any questions please ask me I will try to answer your questions.
 
Ok now I will explain a little bit more of my trading. I think the best way would be a webinar, so if there is any interested please tell me. (Post, PM me).

If there is enough interest maybe we can do that in the future.

The first picture is a screen shot of DAN. This is how one of my screen looks like. I always have a monthly, weekly and daily chart on it. Of course my screener is doing the work for me to find setups like that.

I can see a positive trend on the monthly and weekly chart and the trend continuous on the daily chart. I want to trade the break out and I will place a stop below the low. That is the reason why it was below 12.60 USD

Why I use buy stop limits

DDD is a very good example why I use buy stop limits. It opened with a gap and came back. I got filled and after that it went up again. Of course it will not work always like that but I will not chase a trade. There are so many opportunities so that it makes no sense to chase any trade.

HP that is how a trade should look like


HP is a very good example to see my trading tactics. The break out occurs and the trade immediately kicks off. But a couple of days later we have a negative candle with high volume. This is a warning and I adjust my stop, because I don’t want to risk my gains. So I put the stop below the candle.

Corn

I like commodities because they have nice moves. You can see red candle in the chart this are moving days which my software marks for me. There was a mowing day and after the moving day we had sideway action. I wanted so short if the market breaks out of the sideway action. Furthermore the COT data and Weather made me bearish.
Corn so far was my best trade since I am posting my trades here.
 

Attachments

  • DAN_Chart.png
    DAN_Chart.png
    189.3 KB · Views: 226
  • DDD.png
    DDD.png
    116.6 KB · Views: 180
  • HP.png
    HP.png
    117.8 KB · Views: 208
  • zc.png
    zc.png
    173.4 KB · Views: 192
Ok I ill post every weekend the overviews for the week.

Hope it helps

Merry christmas

RMT
 

Attachments

  • 51-2012.zip
    66.4 KB · Views: 105
Top