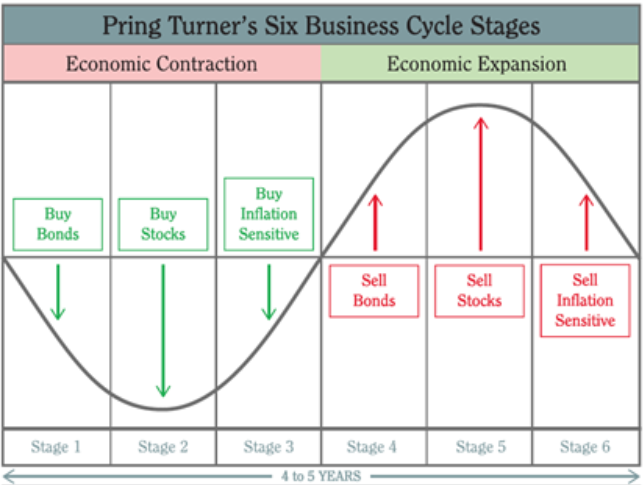
In the beginning of a recovery, consumer spending picks up spearheaded by the housing industry driven in large part by falling interest (finance) rates, followed by the retail sector as stores prepare for increased purchases. Finally, manufacturing activity picks up and demand increases for steel and other raw materials as existing inventory levels fall. As the economy slows, interest sensitive issues gauged by bond prices (which move inversely to interest rates) fall, stock demand drops then commodity prices weaken.
Put simply, in both recoveries and corrections, bonds lead followed by stocks and then commodities.
And as Pring explains, business cycle rotation is not an exact science so not recommended for trade timing but rather as a general macroeconomic gauge.
For perspective, it is useful to compare the past cycle peak and recovery and examine where we are today.
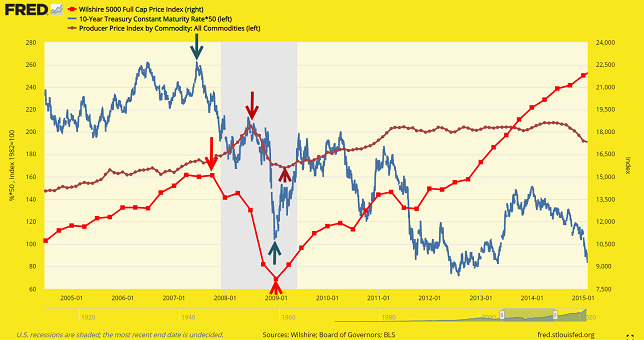
In Figure 2, we see that 10-year bond prices peaked in June 2007, then stocks represented by the Wilshire 5000 in October followed by commodities a year later in October 2008. In the subsequent recovery we see that all three asset classes bottomed much more closely together with bonds hitting their low in December 2008, stocks in January 2009 then commodities in March.

Figure 2. Fed chart comparing bonds (10 year treasuries), stocks (Wilshire 5000) and commodities (Producer Price Index-commodities) between 2005 and 2015. Bonds (blue) peaked in June 2007, stocks (red) in early October and finally commodities (brown) in October 2008. In the 2009 recovery the lags between these asset classes was short with bonds bottoming in December 2008, stocks in January 2009 and commodities in March 2009.
Source: Federal Reserve Economic Data
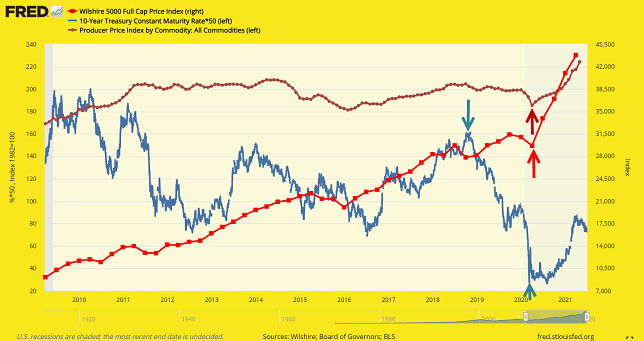
In Figure 3 we examine the latest business cycle from 2010. Bonds clearly peaked in November 2018 but stocks and commodities barely paused before resuming uptrends. Bonds appear to have hit bottom in March 2020 and began to rally, followed by rallies in stocks and commodities in April 2021 in a period that was anything but typical given the covid-19 outbreak and economic reaction as government coffers were liberally dispensed in an attempt to stem the economic fallout.

Figure 3. We see a chart of the latest business cycle, showing that bonds peaked in November 2018 but there were muted signs that stocks or commodities followed suit. Bond prices bottomed in March 2020, followed by rallies in both stocks and commodities in April 2020. Source: Federal Reserve Economic Data
So we see no concrete sign yet in the business cycle to suggest a peak in stock or commodity prices. But there are indications that valuations are getting stretched as Warren Buffett's %91favorite indicator of stock market valuations' hit new all time highs (see Buffett's Indicator).
So will bond prices top out and begin to drop again to warn of the next stock market and commodity top? Only time will tell but as we learn in every major market correction it pays to follow prices and trends in other asset classes for one simple reason.
The correlation between asset classes jumps to one when there is blood flowing on both Wall and Main streets!
Matt Blackman can be contacted at Trading Education
Last edited by a moderator:

