My trading journal - plus wave counting bits (old Trumps surprise visit to N.Korea)

Quick update - Excuse the horrible clashing 1hour chart, just posting this so I can compare notes from previous post. I got the 200EMA kiss, which put 100 or so pips on the GBPUSD.

Slightly confused and one I am going to watch play out on the 4 hour, the line chart looks like rising wedge, which I would expect to be bear movement to downside but candle sticks showing a more flat top wedge which I would expect (more often than not) a bullish continuation to the up side.

I am expecting the higher low candles will be a sign for the bulls... who knows.... no trade on this, just wanting to keep eyes peeled.


1 Hour

View attachment 267384

4 Hour GBPUSD - Closing line.
View attachment 267385
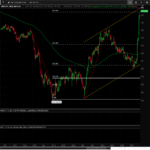
GBPUSD 4hr

View attachment 267386

Set a pending short which triggered whilst at work, this was on the short breakout of the wedge - yield of 60pips my TP was pre-set to the 200 EMA and it smacked it right on the nose, my wave count remains unchanged and looks a little premature. Hide and wait...

So the learning from this, rising wedge forming on the close line chart played out albeit not dramatically. Looks like this pair has slipped into side ways movement which I may stay away from, but yet again has has a positive retest of the 200EMA (hourly), so will this be springboard up to a monthly high?

267501
267502
 
Happy Sunday Fibo et al.

GBPJPY for the week;

1 hour looks like 5 wave up complete, awaiting ABC down - MACD + RSI convergence, I am expecting price to head to the 130.00 point - based on .618 / 200 EMA / break of previous support, I expect this to be retested.

4 hour - A B C to complete the intermediate wave 1 down to the support of 130.00 would look to get involved here with on completion of wave 1 down to the .618.

Thoughts welcome!
1Hr
View attachment 267276


4hr
View attachment 267275

Mid-week look back - rudimentary waves up look to be playing out nicely, nothing changed on the chart... yes still a mess, but this is all for learning.

My C wave completing the corrective ABC, now 1 - 5 impulsive waves playing out.. who know! I was expecting a test of 200EMA as mentioned in previous post (time stamped), which almost within a few pips played out, and the long commenced nicely upward.
Top pink trend line it would and been broken (albeit very messy) expect this to be retested, bullish pressure continues MACD & RSI still looking to upside.


267503
 
I have a fear Fibo may have been banned?

A great shame if so, he provided valuable input and certainly gave me ample guidance, feedback and laughs.

Surely the three things that are so crucial for making a resource like T2W worth having?

No body else provided feedback quite like he did, certainly on my posts.
 
Mid-week look back - rudimentary waves up look to be playing out nicely, nothing changed on the chart... yes still a mess, but this is all for learning.

My C wave completing the corrective ABC, now 1 - 5 impulsive waves playing out.. who know! I was expecting a test of 200EMA as mentioned in previous post (time stamped), which almost within a few pips played out, and the long commenced nicely upward.
Top pink trend line it would and been broken (albeit very messy) expect this to be retested, bullish pressure continues MACD & RSI still looking to upside.


View attachment 267503


267670


Righteo - Sunday night analysis. Yes messy charts.

Above is the play out of the move posted a couple of weeks ago, nothing really changed and my black line prediction played out nicely, albeit slightly out of sequence. The Blue trend line structure has broken with a chunky C leg down which doesnt appear to have finished, so expecting the short to play out this week but not before a retest of the broken blue support upto the 134.500 then a short involved. RSI and MACD confluence to the down side. Noting that my 5th wave landed on the 1.618 extension.

I have noticed that when markets open on a sunday, any movement whether up or down usually ends up heading back to its open price head of the London 8am open. So something I will watch play out.

Will the resident waver return... only when playing grand piano.
 
267671


Similar story on the GBPUSD, some strong support broken I have a pending short set as you can see on the right, with my entry slightly more refined and TP since this post. So do we this a 3rd wave complete and a wave 4 down underway.

As with all these things hide and wait... but I am short to 1.2300 area.
 
View attachment 267671

Similar story on the GBPUSD, some strong support broken I have a pending short set as you can see on the right, with my entry slightly more refined and TP since this post. So do we this a 3rd wave complete and a wave 4 down underway.

As with all these things hide and wait... but I am short to 1.2300 area.

Another Sunday comes and goes - time for the weekly charts.

Below Ive posted the 4hr, nothing changed on the chart from last week - with my short projection down to the yellow (4) complete. but see the subwave green 5 waves down, I will be looking to short on the demo down to the 1.22100, which I make this to be the 3rd wavedown, before retracing up to the red trendline at the 1.2300 area. I would look to get involved here on the break of the closest red trendline.

View attachment 267671

Similar story on the GBPUSD, some strong support broken I have a pending short set as you can see on the right, with my entry slightly more refined and TP since this post. So do we this a 3rd wave complete and a wave 4 down underway.

As with all these things hide and wait... but I am short to 1.2300 area.


Another Sunday comes and goes - time for the weekly charts. In summary, short continues, no break on RSI or Trendline.
267779


Below Ive posted the 4hr, nothing changed on the chart from last week - with my short projection down to the yellow (4) complete. but see the subwave green 5 waves down, I will be looking to short on the demo down to the 1.22100, which I make this to be the 3rd wavedown, before retracing up to the red trendline at the 1.2300 area. I would look to get involved here on the break of the closest red trendline.

267778
 
View attachment 267671

Similar story on the GBPUSD, some strong support broken I have a pending short set as you can see on the right, with my entry slightly more refined and TP since this post. So do we this a 3rd wave complete and a wave 4 down underway.

As with all these things hide and wait... but I am short to 1.2300 area.


As per the time stamp on my original post here - I showed my short position to 1.2300 area, which I have shown in the chart and this played out nicely and I took my profit. So I will be short again to the 1.2200, but live I don't know... as there is some pretty chunky rejections around this area.
 
View attachment 267670

Righteo - Sunday night analysis. Yes messy charts.

Above is the play out of the move posted a couple of weeks ago, nothing really changed and my black line prediction played out nicely, albeit slightly out of sequence. The Blue trend line structure has broken with a chunky C leg down which doesnt appear to have finished, so expecting the short to play out this week but not before a retest of the broken blue support upto the 134.500 then a short involved. RSI and MACD confluence to the down side. Noting that my 5th wave landed on the 1.618 extension.

I have noticed that when markets open on a sunday, any movement whether up or down usually ends up heading back to its open price head of the London 8am open. So something I will watch play out.

Will the resident waver return... only when playing grand piano.

As my time stamped charts - the retest of the 134.500 and the short entry metrics were met, got involved and the short played out.
The short is still continuing RSI and trend line, both intact and the continuation of the trend still short. Although 132.200 is a round number, to a psychological level, would I be going short at market open... no but if I rejection of the trendlineat 133.000 I would look to get short.

Hide and wait....
267780
 
As my time stamped charts - the retest of the 134.500 and the short entry metrics were met, got involved and the short played out.
The short is still continuing RSI and trend line, both intact and the continuation of the trend still short. Although 132.200 is a round number, to a psychological level, would I be going short at market open... no but if I rejection of the trendlineat 133.000 I would look to get short.

Hide and wait.... View attachment 267780


Nice rejection off the 133.000 area. RSI and trendlone barely broken in the course of the day. Short entry rules met - in I go.... short...
 
Another Sunday comes and goes - time for the weekly charts.

Below Ive posted the 4hr, nothing changed on the chart from last week - with my short projection down to the yellow (4) complete. but see the subwave green 5 waves down, I will be looking to short on the demo down to the 1.22100, which I make this to be the 3rd wavedown, before retracing up to the red trendline at the 1.2300 area. I would look to get involved here on the break of the closest red trendline.


Another Sunday comes and goes - time for the weekly charts. In summary, short continues, no break on RSI or Trendline.View attachment 267779

Below Ive posted the 4hr, nothing changed on the chart from last week - with my short projection down to the yellow (4) complete. but see the subwave green 5 waves down, I will be looking to short on the demo down to the 1.22100, which I make this to be the 3rd wavedown, before retracing up to the red trendline at the 1.2300 area. I would look to get involved here on the break of the closest red trendline.

View attachment 267778

Here we go - Sunday night chart analysis... update on time stamp and commentary below... I have just posted the current chart, with my Short to 1.22100 played out almost to the pip which I am happy with, plus the retest of the 1.23000, in fact this blew straight through the level - I unfortunately didn't set a pending buy for this but would have gone nicely in my favor.

We are still short on this pair, expecting price to head 1.215000 - I think... but the second chart has a rising lower red trendline, I would look to get short to my target price (entry at 1.22650) hold short to 1.215000. I have also moved the wave predictions to current price action.

Thoughts welcome.
268045

The above 4hr chart is last weeks wave prediction against current price action.


Note the bottom red trend line forming a wedge - break of this trendline to the downside I will look to get involved in the entry criteria above.

268046
 
As my time stamped charts - the retest of the 134.500 and the short entry metrics were met, got involved and the short played out.
The short is still continuing RSI and trend line, both intact and the continuation of the trend still short. Although 132.200 is a round number, to a psychological level, would I be going short at market open... no but if I rejection of the trendlineat 133.000 I would look to get short.

Hide and wait.... View attachment 267780

Short to 134.200 played out, but I had my stop loss blown apart due to my 2:1RR rules.

I would need to hold fire on entering short - notice red horizontal zone - 5th wave down would need to breach this, not a high enough probability trade for me to enter. I would look to get long on a break of the angled trend line, long from the 0.618 and 200EMA zone.
268047
entry at 133.000.
 
Happy Sunday all...

Its that time of the week I sit down in my living room and analyse the charts for the coming 5 days - usually focusing on the main forex pairs.

This morning we woke to news of trumps surprise visit to N.K, I have set my pendings as I am expecting this to provoke a gap up on the USDGBP and set the tone for a bullish weeks for the dollar against all currency pairs.

What are your views? apologies if this is in the wrong place to post!

Regards,
Sam


In review with the benefit of hindsight, this opening post scores 100% in Fibo's book. The 5 trading days the op was looking at, had just occurred and completed a day before Trump's arrival. The weekly dollar index chart was dropping momentum and daily dollar index charts was in a correction. But the op called it right. He said, "bullish weeks for the dollar against all currency pairs"

Dollar Index has been going up for weeks more since op called it.

A+++
 
Regarding op trades on dollar gbp or dollar vs others keep in mind that US Dollar Index has arrived at Fibo's resistance target on October 1 after a long runup since Feb 16, 2018. Will it blast thru' or reverse? Follow it on 1H. The resistance is a significant one. OP said dollar index would go up for weeks and it sure as heck it, but now I'm seeing something I don't like ............... an Ending Diagonal Triangle which as we wavers know should consist of abc for each internal wave. This setup sure is following that pattern.

But what if the triangle is a leading diagonal implying the first wave of a new series right at Fibonacci resistance? That could be a blast-off north bound that would scare the daylights out of everyone.

So there are 2 possibilities. Yeah yeah yeah, I know, what a crock, what a cop out saying its going either north or south, hahahaha. But that's where I am at. It really could go either way. I don't know.

Caution for pair traders

Thank you Fibo - this forum is a great resource for the timestamp. I will GBP USD is next on my list, but below is my week, day and 4hr on the GBPJPY for the trading week ahead. I have established my entry and exit and TP, my trade is set as follows;

SELL

MOST IMPORTANT STOP LOSS LEVEL - Stop loss set at 137.919.
A level last tested at 28th June and a snip above the month high. The risk on this trade is a 1.4/1 risk to reward.

ENTRY - 136.950 pending set roughly 15 pips below friday close. This is to ensure I don't get busted in the yazoo should price carry on north on market open and my ANALysis is wrong!


I am looking to catch the short down to a level of previous support and 76.4% fibo level, which is support across daily and 4hr.
I think after such a profitable move, psychology tells me... maybe some profit taking and a retest of this previous support level. So why is my TP not slap bang on the fibo level, this is because I want to be sure I catch a large majority of the move, and not get whipsawed out of the position.

TAKE PROFIT - 135.594 should this move play out it might yield 136 pips... this profit target has been selected as it is a historic key level of support and recently turned resistance, which I expect to be a break and retest.


WEEKLY - 50 EMA in purple and 200 in Blue. the 50 as been broken and not retested. Also acts as a strong support and resistance. Price below both 200 and 50 = bearish stance in my rules.

268514


DAILY - the FX pro full screen mode isn't great. But stay with me, the Fibo grid in purple shows the 76.4% as a key previous support level, which was busted through on Friday, so I fancy a retest of this level down to green spot. RSI topping out? Notice RSI ratios. See what happen at this level on 15th September.. we are slightly above this now, so I believe It to be cooling off with profit taking.


268515


4HOUR - Click on this one and see the levels and trend lines. notice how the exhaustive move came on the touch of the 2 trend lines in yellow. Fibo grid removed on this so we can see price action. My take profit is set at the green spot - the red exhaustive red candle and also a few long wicks, price pushed but not closed in strong position. again, notice RSI is very strong but notice this is unfound heights in last couple of months. We do have a 50x200 ema cross, which is a strong buy signal - but I think the strong support levels held and the RSI for me is a stronger?... learning maybe.

268516


This is for my education, not investment advice!
 
Thank you Fibo - this forum is a great resource for the timestamp. I will GBP USD is next on my list, but below is my week, day and 4hr on the GBPJPY for the trading week ahead. I have established my entry and exit and TP, my trade is set as follows;

SELL

MOST IMPORTANT STOP LOSS LEVEL - Stop loss set at 137.919.
A level last tested at 28th June and a snip above the month high. The risk on this trade is a 1.4/1 risk to reward.

ENTRY - 136.950 pending set roughly 15 pips below friday close. This is to ensure I don't get busted in the yazoo should price carry on north on market open and my ANALysis is wrong!


I am looking to catch the short down to a level of previous support and 76.4% fibo level, which is support across daily and 4hr.
I think after such a profitable move, psychology tells me... maybe some profit taking and a retest of this previous support level. So why is my TP not slap bang on the fibo level, this is because I want to be sure I catch a large majority of the move, and not get whipsawed out of the position.

TAKE PROFIT - 135.594 should this move play out it might yield 136 pips... this profit target has been selected as it is a historic key level of support and recently turned resistance, which I expect to be a break and retest.


WEEKLY - 50 EMA in purple and 200 in Blue. the 50 as been broken and not retested. Also acts as a strong support and resistance. Price below both 200 and 50 = bearish stance in my rules.

View attachment 268514

DAILY - the FX pro full screen mode isn't great. But stay with me, the Fibo grid in purple shows the 76.4% as a key previous support level, which was busted through on Friday, so I fancy a retest of this level down to green spot. RSI topping out? Notice RSI ratios. See what happen at this level on 15th September.. we are slightly above this now, so I believe It to be cooling off with profit taking.


View attachment 268515


4HOUR - Click on this one and see the levels and trend lines. notice how the exhaustive move came on the touch of the 2 trend lines in yellow. Fibo grid removed on this so we can see price action. My take profit is set at the green spot - the red exhaustive red candle and also a few long wicks, price pushed but not closed in strong position. again, notice RSI is very strong but notice this is unfound heights in last couple of months. We do have a 50x200 ema cross, which is a strong buy signal - but I think the strong support levels held and the RSI for me is a stronger?... learning maybe.

View attachment 268516

This is for my education, not investment advice!


Pay attention now, Trade2Lose:

do you see this guy, ssam's entire post here? Look again. See the entry, the TP, the stoploss? These are all numbers. See the timestamp? This is what is required for traders to get to specifics not generalities. And this guy is a newbie. Calls for a celebration as this is the first real trader at a place called Trade2Win and can already easily blow out the current old lions that have made a monkey of this place. Right or wrong in the trade, it does not matter, we can follow along easily as we know the SPECIFICS. Now that's progress.

Hahahahahahaha, and its this very same newbie who got me unbanned!!!!!!!!!!!!!!!!!!! The Lord sure works in mysterious ways. Amen! Many thanks to ssam for bringing me back to Shenanigan2Win Central :) :)


What's ssam doing? He's just standing in a doorway, trying to make some sense ............... same thing as Mick is doing

 
Thank you Fibo - this forum is a great resource for the timestamp. I will GBP USD is next on my list, but below is my week, day and 4hr on the GBPJPY for the trading week ahead. I have established my entry and exit and TP, my trade is set as follows;

SELL

MOST IMPORTANT STOP LOSS LEVEL - Stop loss set at 137.919.
A level last tested at 28th June and a snip above the month high. The risk on this trade is a 1.4/1 risk to reward.

ENTRY - 136.950 pending set roughly 15 pips below friday close. This is to ensure I don't get busted in the yazoo should price carry on north on market open and my ANALysis is wrong!


I am looking to catch the short down to a level of previous support and 76.4% fibo level, which is support across daily and 4hr.
I think after such a profitable move, psychology tells me... maybe some profit taking and a retest of this previous support level. So why is my TP not slap bang on the fibo level, this is because I want to be sure I catch a large majority of the move, and not get whipsawed out of the position.

TAKE PROFIT - 135.594 should this move play out it might yield 136 pips... this profit target has been selected as it is a historic key level of support and recently turned resistance, which I expect to be a break and retest.


WEEKLY - 50 EMA in purple and 200 in Blue. the 50 as been broken and not retested. Also acts as a strong support and resistance. Price below both 200 and 50 = bearish stance in my rules.

View attachment 268514

DAILY - the FX pro full screen mode isn't great. But stay with me, the Fibo grid in purple shows the 76.4% as a key previous support level, which was busted through on Friday, so I fancy a retest of this level down to green spot. RSI topping out? Notice RSI ratios. See what happen at this level on 15th September.. we are slightly above this now, so I believe It to be cooling off with profit taking.


View attachment 268515


4HOUR - Click on this one and see the levels and trend lines. notice how the exhaustive move came on the touch of the 2 trend lines in yellow. Fibo grid removed on this so we can see price action. My take profit is set at the green spot - the red exhaustive red candle and also a few long wicks, price pushed but not closed in strong position. again, notice RSI is very strong but notice this is unfound heights in last couple of months. We do have a 50x200 ema cross, which is a strong buy signal - but I think the strong support levels held and the RSI for me is a stronger?... learning maybe.

View attachment 268516

This is for my education, not investment advice!


Step by step: Weekly first

Excellent chart, can't disagree with anything you said. Here's mine, not necessarily better, just some slight differences, that's all. Of course you will note the obvious Fibo grid and therefore not the blast-off point for the rally and the current hit at major resistance. The 2nd trendline you have drawn, you will notice I do not have. That's becaue I will wait for the upwave to complete because. Therefore this 2nd line belongs on the daily timeframe


268518
 
Thank you Fibo - this forum is a great resource for the timestamp. I will GBP USD is next on my list, but below is my week, day and 4hr on the GBPJPY for the trading week ahead. I have established my entry and exit and TP, my trade is set as follows;

SELL

MOST IMPORTANT STOP LOSS LEVEL - Stop loss set at 137.919.
A level last tested at 28th June and a snip above the month high. The risk on this trade is a 1.4/1 risk to reward.

ENTRY - 136.950 pending set roughly 15 pips below friday close. This is to ensure I don't get busted in the yazoo should price carry on north on market open and my ANALysis is wrong!


I am looking to catch the short down to a level of previous support and 76.4% fibo level, which is support across daily and 4hr.
I think after such a profitable move, psychology tells me... maybe some profit taking and a retest of this previous support level. So why is my TP not slap bang on the fibo level, this is because I want to be sure I catch a large majority of the move, and not get whipsawed out of the position.

TAKE PROFIT - 135.594 should this move play out it might yield 136 pips... this profit target has been selected as it is a historic key level of support and recently turned resistance, which I expect to be a break and retest.


WEEKLY - 50 EMA in purple and 200 in Blue. the 50 as been broken and not retested. Also acts as a strong support and resistance. Price below both 200 and 50 = bearish stance in my rules.

View attachment 268514

DAILY - the FX pro full screen mode isn't great. But stay with me, the Fibo grid in purple shows the 76.4% as a key previous support level, which was busted through on Friday, so I fancy a retest of this level down to green spot. RSI topping out? Notice RSI ratios. See what happen at this level on 15th September.. we are slightly above this now, so I believe It to be cooling off with profit taking.


View attachment 268515


4HOUR - Click on this one and see the levels and trend lines. notice how the exhaustive move came on the touch of the 2 trend lines in yellow. Fibo grid removed on this so we can see price action. My take profit is set at the green spot - the red exhaustive red candle and also a few long wicks, price pushed but not closed in strong position. again, notice RSI is very strong but notice this is unfound heights in last couple of months. We do have a 50x200 ema cross, which is a strong buy signal - but I think the strong support levels held and the RSI for me is a stronger?... learning maybe.

View attachment 268516

This is for my education, not investment advice!


Daily: Well put. Instead of a retracement grid I have the most recent downwave target showing and how the very same grid's blast-off point and resistance fit it. Then I can do a daily chart which examine just the new upwave from the blastoff point for measurements and TP estimation.


268519
 
Thank you Fibo - this forum is a great resource for the timestamp. I will GBP USD is next on my list, but below is my week, day and 4hr on the GBPJPY for the trading week ahead. I have established my entry and exit and TP, my trade is set as follows;

SELL

MOST IMPORTANT STOP LOSS LEVEL - Stop loss set at 137.919.
A level last tested at 28th June and a snip above the month high. The risk on this trade is a 1.4/1 risk to reward.

ENTRY - 136.950 pending set roughly 15 pips below friday close. This is to ensure I don't get busted in the yazoo should price carry on north on market open and my ANALysis is wrong!


I am looking to catch the short down to a level of previous support and 76.4% fibo level, which is support across daily and 4hr.
I think after such a profitable move, psychology tells me... maybe some profit taking and a retest of this previous support level. So why is my TP not slap bang on the fibo level, this is because I want to be sure I catch a large majority of the move, and not get whipsawed out of the position.

TAKE PROFIT - 135.594 should this move play out it might yield 136 pips... this profit target has been selected as it is a historic key level of support and recently turned resistance, which I expect to be a break and retest.


WEEKLY - 50 EMA in purple and 200 in Blue. the 50 as been broken and not retested. Also acts as a strong support and resistance. Price below both 200 and 50 = bearish stance in my rules.

View attachment 268514

DAILY - the FX pro full screen mode isn't great. But stay with me, the Fibo grid in purple shows the 76.4% as a key previous support level, which was busted through on Friday, so I fancy a retest of this level down to green spot. RSI topping out? Notice RSI ratios. See what happen at this level on 15th September.. we are slightly above this now, so I believe It to be cooling off with profit taking.


View attachment 268515


4HOUR - Click on this one and see the levels and trend lines. notice how the exhaustive move came on the touch of the 2 trend lines in yellow. Fibo grid removed on this so we can see price action. My take profit is set at the green spot - the red exhaustive red candle and also a few long wicks, price pushed but not closed in strong position. again, notice RSI is very strong but notice this is unfound heights in last couple of months. We do have a 50x200 ema cross, which is a strong buy signal - but I think the strong support levels held and the RSI for me is a stronger?... learning maybe.

View attachment 268516

This is for my education, not investment advice!


4H:


I notice you drew a trendline connecting the 2 tops. Here's the thing though ......................... might be better to draw a base trendline from the 1st low to the 2nd low and extend and then create the channel (gold or yellow line) do you see that GBPJPY has not yet hit the top of the channel? It might or it might not, but its good to have it there as it provides a good frame of reference. Then I drew a FIBO grid from the actual low, not from the subsequent wave lows as none are the real low. It can work sometimes from secondary lows but an actual wave low of significance is superior. So therefore the grid from the August 11 low on 4H gives a perfect 423.6% hit for Friday.

Fibo is no jive turnkey, he saw the W1, then the W2, then the Wave3, then the Wave 4 and finally the Wave 5. So being of such intemperate disposition as to have no Friends at T2L, he thought to hisself, "nobody ever lost money by getting out early or just short of too late" Can always get back in if wrong and the 423.6% is taken out topside and heading out on yet another modified grid. But we don't know that just yet, we go with what we see.

Big profits like this is nothing to laff at. It could feed 10 countries if we got all the billionaires in the world to pool in Capital and give it to Fibo for just this one trade or hundreds of similar trades like this one, we could feed the world's poor on the profits and keep rolling the Capital from one play to the next. World hunger solved. FIBO got the balls to pull this off - but do the rich punks want to help the poor? Hell no, they don't give a rat's ass. Even though they would know in a heartbeat that Fibo's job is turning Lead into Gold and that he can do this even if his head is aching and his hands are cold - for he has found the Philospher's Stone after decades of travel in search of it. It now belongs to Fibo. And its signed by the only one who counts - THE MAN hissself.


268520
 
GBPJPY:

note the velocity and thrust of the last wave up on 4H. Even more dramatic on 1H. that's what you call full throttle. I said 5 waves, right? But dig this: what if the 1st wav up is a 1-2 and the 2nd wave up is also a 1-2 but as part of the 3rd wave? Ahahahahaha, he ain't no dummy, this fibo, he can see the ramifications, hahahaha. this means that the fiery explosive burst of power we saw is a 3rd of 3rd which is is exactly what a waver would expect.

But I'm getting ahead of myself here ..... I need to review even further the monthly chart timeframe to get a better feel for what this cat, GBPJPY is tryng to say to me.

But the 3rd of 3rd is seen clearly here on the ground in real life by the best example I know of because I am the witness on a near weekly basis of such 3rd or 3rd on the roads of Angeles Crest and will repeat on the road from Paris to Nice next time again.


What does a 3rd wave look and feel like on the ground on the road? Exactly like this and when FIBO drives, its just sheer poetry because he knows the theory behind the 3rd of 3rd and that then comes a period of rest in the 4th wave before flooring it in the 5th. then Fibo must STOP as 5 waves are complete. Fibo must get out of the car and honor the inevitable A-B-C correction that is for sure to come right away. Therefore coffee shop time., read the paper, listen to Mick Jagger or Van Morrison and drive like a slowpoke therafter for the rest of the day ............... :) :) :whistle: :whistle:


3rd wave takes off at 1:06 in the video


Attachments

  • 1570977410936.png
    1570977410936.png
    98 KB · Views: 123
4H:


I notice you drew a trendline connecting the 2 tops. Here's the thing though ......................... might be better to draw a base trendline from the 1st low to the 2nd low and extend and then create the channel (gold or yellow line) do you see that GBPJPY has not yet hit the top of the channel? It might or it might not, but its good to have it there as it provides a good frame of reference. Then I drew a FIBO grid from the actual low, not from the subsequent wave lows as none are the real low. It can work sometimes from secondary lows but an actual wave low of significance is superior. So therefore the grid from the August 11 low on 4H gives a perfect 423.6% hit for Friday.

Fibo is no jive turnkey, he saw the W1, then the W2, then the Wave3, then the Wave 4 and finally the Wave 5. So being of such intemperate disposition as to have no Friends at T2L, he thought to hisself, "nobody ever lost money by getting out early or just short of too late" Can always get back in if wrong and the 423.6% is taken out topside and heading out on yet another modified grid. But we don't know that just yet, we go with what we see.

Big profits like this is nothing to laff at. It could feed 10 countries if we got all the billionaires in the world to pool in Capital and give it to Fibo for just this one trade or hundreds of similar trades like this one, we could feed the world's poor on the profits and keep rolling the Capital from one play to the next. World hunger solved. FIBO got the balls to pull this off - but do the rich punks want to help the poor? Hell no, they don't give a rat's ass. Even though they would know in a heartbeat that Fibo's job is turning Lead into Gold and that he can do this even if his head is aching and his hands are cold - for he has found the Philospher's Stone after decades of travel in search of it. It now belongs to Fibo. And its signed by the only one who counts - THE MAN hissself.


View attachment 268520

Magnifique, thank you for taking the time to review each time frame. Noted on your 4hr - I am curious to see whether the TL or the 423.6% is respected first. So your fibo grid is projected from the wave 1 of the significant low. So 0-100% Fibo on wave 1 and extended which shows price structure breaking and retesting the 161.8% and 261.8%.

The termination of wave 2 (where the golden yellow bottom TL starts) looks to be valid as not breaking low of wave 1 start.
Will the 423.6% become the termination of wave 5, with A wave correction starting from the zone.
 
Top