my journal

Status
Not open for further replies.
Hey, check it out. The same exact position, just one hour later. This sucks. Unfortunately, overall, it makes sense to not tamper: so I'll just have to get used to letting these big gains slip through my hands, because overall it does pay off to do so. After a whole month of not tampering, it still isn't easy to neither start brand new trades, nor to close early trades that were started by the system.
 

Attachments

  • Snap1.jpg
    Snap1.jpg
    8.9 KB · Views: 180
No way! Now it's getting even worse...


Attachments

  • Snap1.jpg
    Snap1.jpg
    8.9 KB · Views: 186
Holy cow... my loss is getting bigger all the time... from +200 to -200 in just 2 hours. That's a really wide and unusual move for the GBP. I'm still feeling ok, believe it or not, and it's because it wasn't my trade. It was placed by a system I created yes but it doesn't feel like my trade, maybe because I feel that the system was created by statistics - I only had to hear what statistics had to tell me and adapt my code to it. Had I made this trade, via discretionary trading, I would have been praying from -20. The system doesn't mind instead. He seems quite relaxed. It's giving me tranquility.


Attachments

  • Snap1.jpg
    Snap1.jpg
    7.6 KB · Views: 185
Last edited:
I've updated the forward testing maximum drawdown for all systems, because they change every week, and I haven't found a way to automate this part on excel (the sum of all negative days, so to get the biggest drawdown by summing up the series of the worst trading days).

If I understand correctly, then you can do this by adding an extra column in Excel. The column tracks what I've called the "running drawdown," which is like a running total except that it gets reset to zero whenever there is a positive day. Then you use the min() function on that column to find the biggest drawdown.

Hopefully the piccy explains better than words:
 

Attachments

  • drawdown.PNG
    drawdown.PNG
    11.4 KB · Views: 160
Oh, I just saw your post. This will take a while, probably. I will answer later. I have to go offline for a while: I have to go for a swim in my bathtub. My one position is getting better: -110 right now.
 
Oh, I just saw your post. This will take a while, probably. I will answer later. I have to go for a swim in my bathtub.

Probably for the best, I think I made a mistake in it :LOL:

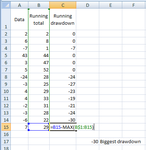
What I posted before finds the largest fall made up of consecutive losses. However I now realise that "biggest drawdown" actually means the biggest fall from the historical peak, even if there's a bit of up and down action along the way.

Hopefully this is closer to the mark:
 

Attachments

  • drawdown2.PNG
    drawdown2.PNG
    14.8 KB · Views: 166
Ok, I'll answer in a few minutes. In the meanwhile, I saw it coming, yet another discretionary trade by me, on the EUR (big opportunity!). Sorry everyone: big breaking of rules once again. I went LONG on the EUR.

The GBP is losing big time and I think this added to my frustration, and made me think: "oh yeah? I'll show you now!".

So now I am losing 240 dollars on the GBP (the system is long), and I am making already 35 on the EUR (obviously it touched bottom). I just knew very clearly on Friday that breaking my rule once meant going wild in the future. And it's happening, little by little. Ironically, I made money Friday and I will make money today because that's how it goes when I am still prudent, but it only lasts a few wins. Then I get cocky and give everything back plus more money (ALWAYS). One day I'll get cocky, make a mistake, double up triple up on the mistake, and lose my entire capital.

Anyway, now I'll post my loss on the GBP, and then I'll get down to answering your questions.
 

Attachments

  • Snap1.jpg
    Snap1.jpg
    9.3 KB · Views: 151
If I understand correctly, then you can do this by adding an extra column in Excel. The column tracks what I've called the "running drawdown," which is like a running total except that it gets reset to zero whenever there is a positive day. Then you use the min() function on that column to find the biggest drawdown.

Hopefully the piccy explains better than words:

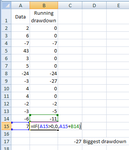
Ok, so far (I read the next post and reply to it next) I thank you very much for taking the time to help but I slightly disagree. I would say the drawdown, the way I compute it, is close to 38 (one more one less). Indeed. Because if you lose 27 on a trade and then the next is a +1, it doesn't delete your whole loss but just 1, so that you'll be at -26. Then the next trade is negative, you add it to that... let me show you the way I'd compute it (but I don't know what formula would automate that).

-3
dd -3
+2
dd -1
-5
dd -6
+6
dd 0
then you could start all over again (if tha can help)

So maybe I'd use this condition: NOT if next trade is positive reset everything, but if the count becomes positive reset everything, but then again I don't know what I am talking about: my brain is melted from work already. All day long on excel!

Hold on... maybe something is growing in my head... like an idea... here it is, brainstorming-style: we can't keep on adding trades forever because that won't work either, but we can't stop adding trades either. I'd say we stop adding trades if the count becomes 0. But how? Hold on... thinking and testing... (then later I'll see if you got it already in your next post: right now I don't want to lose my train of thought).
 
Holy cow! Holy cow! I found it!!! Thanks so much for your input, otherwise I wouldn't have gotten to it. You saved me one hour of work per week for all future weeks of my life. In the posted excel sample I am using the real drawdown of one of my systems. I will now read your answer to see if you provided me with the good answer in your second post. Thank you.
 

Attachments

  • Book1.xls
    15.5 KB · Views: 182
It's beautiful how this formula works, but I still don't get how it works so beautifully. Thanks for making me realize it could be done.
 
Wow, it works from all points of view and it works on all dozens of systems, and to think that for weeks and months I added all these figures manually, exactly like the formula does, and I never thought I could come up with it... What a great thing you told me. See, good thing I am posting here this apparently useless journal... it's more what I get from the readers than what I give.
 
Probably for the best, I think I made a mistake in it :LOL:

What I posted before finds the largest fall made up of consecutive losses. However I now realise that "biggest drawdown" actually means the biggest fall from the historical peak, even if there's a bit of up and down action along the way.

Hopefully this is closer to the mark:

Great. Your second example nails it 100% in terms of logic, but your formula still does not coincide with the way I compute my drawdown.

You see, in your sequence of trades, I would identify manually and by eye, your biggest drawdown as -38, as I said above (my formula gets it right). Because, you see: you have that -27, then you 4+4=8, so you are at -19, but then you get -2 -3 -6 = -11... oh ****... wait you are right -30, but did you change the figures or what? Earlier on it was -38. Let me check.
 
I don't know where I got that 38 from. You're totally right on the second one, but the thing is that I am burned out from work. I don't know how you figured out such a good and simple formula (though it requires two columns, which I don't like), but it works 100%. Now I'll not only have to figure out why my formula works but also why yours works. I am bad at formulas.
 
Ok, now I understand why I don't understand your formula: largely because I cannot see the formula, the one on the second column. Secondly, because I am bad at formulas. But if I don't see it, then I can't imagine it. Could you please post the excel workbook next time? If you get the chance, because otherwise I am already grateful to you for telling me that it could be done and which way to try.
 
In the meanwhile, if anyone cared to know, here's how it ended, as far as my discretionary EUR trade and my automated GBP trade. I lost on the automated one and made money on the discretionary one, just like last Friday, but listen carefully: this would seem great, but it doesn't always work like this.

What we saw is wins by me, and losses by the system. This shows partly the problem, if you look carefully. We saw small wins by me, and small losses by the system. Wait till you see the size of my losses and the size the system's wins, because only then you will see the whole picture.

What screws me is that automated trading has limited losses, whereas discretionary trading has limited wins. Then, conversely, automated trading is capable of huge wins, whereas (my) discretionary trading is only capable of huge losses (no small losses, simply because I cannot take losses, and I'd rather blow out my account). So you see why I end up blowing out my account with discretionary trading.

Once again: my discretionary has small wins, and huge losses. (My) automated has small losses and huge wins. And we've seen it happening both on Friday and today. What we didn't see (we did but on other, separate, days) is the big wins by auto and big losses by discretionary.

And why do I get small wins with my discretionary trading? My personal style of trading is simply not profitable. And why? Many reasons, among which: without being backed by statistics (since I can't compute them in my mind), I don't have the guts to stay in a positioin for as long as it's convenient. And I don't have the guts to get out of a position as soon as it stops being convenient. In other words, like many other traders, I can't let profits run, and I can't cut my losses (and this, I'll admit, it's all psychological, because I have agreed that discretionary trading is largely psychological - which doesn't mean that you can ever learn to become profitable by working on your psychology, but rather by finding a profitable method that you will follow, despite what your psychology tells you to do, because you know that method is profitable, and therefore trading is always about having a profitable method: but you might have problems developing it if your psychology is wrong... I still have not figured out and I can't possibly synthesize the nature of the profitability problem in discretionary trading).
 

Attachments

  • Snap1.jpg
    Snap1.jpg
    13.3 KB · Views: 149
Last edited:
My second column is just the sum of all data to date. I could equally have called it Account Equity.

Both our formulae give the same answer against the data you posted, and after scratching my head for a while I see that they do the same thing, but in completely different ways.

The key to the problem was identifying the peak account equity, so you can see how much you have fallen from there. My formula finds peak equity by using the max() function on all earlier values in my extra column, whereas yours does it by resetting itself to zero every time the equity hits a new peak.

I found yours hard to understand at first, but now I get it I much prefer it to mine. Having it in a single column is a far more elegant solution, nice one!
 
Thanks, and as usual, I understand neither, just like when someone else (wprins) asked me for a formula, and I posted it (straight from tradestation) without understanding it, and he was satisfied. But in this case, you saved me one hour of work per week for the rest of my life, so thank you very much for "luring" me into this "find the formula" contest. Seriously, I am having problems understanding my own formula: I am very practical with things, and I focus more on getting what I need rather than understanding it. So basically sometimes even at work I tell them how to do something or I do something for them without even understanding what data or statistics I am giving them. I feel stupid. But partly the reason is that I am working too hard, and my brain shuts itself down in unnecessary areas in order to not burn out.

Of course, once I'll quit my job, and I'll swim all day long, I'll most likely come back here to figure out your and my formula. That is, if those areas of my brain I need to do so, are still functioning. Or then I'll go back to elementary school. Which I'd like to do anyway, because I wasn't taught math properly. I'll go back with a shotgun, just in case.
 
Last edited:
Anyway, I'll post my formula again, after having formatted it a little better, for future reference. So, thanks again. I think in some sense school has condemned me to some form of stupidity, because they ranked me, gave me grades, and I was a rebel, and I rejected all this, and then they denied all subjects to me, because they marked me as "no good". Once you are told, as a child, that you're not good. Pygmalion effect and so on... you don't believe in yourself, and you give up... and your reasoning gives up as well. Basically they condemn you to stupidity. I know I am not that stupid, but I could have been more intelligent if they hadn't told me (my dad and teachers) that I sucked.
 

Attachments

  • dd_formula_final.xls
    16 KB · Views: 210
Last edited:
It's a bit of a head-scratcher alright lol.

I've attached that workbook in case you want to play around with it. I've put your formula and mine side by side.

My "extra" column C is quite helpful in understanding what's going on. It represents account equity, and you can see how both our formulae return zero whenever equity hits a new all-time high.

Drawdown is how far we have fallen from the all-time high. Your formula keeps track of that in a particularly neat way.
 

Attachments

  • drawdown.xls
    22.5 KB · Views: 337
Status
Not open for further replies.
Top