My Investing Journal

yurtrader

Junior member
Messages
42
Likes
9
Hey Guys! This is the beginning of my journal.

My First Purchase is FITB. What I'm really concerned about is, does the pattern look like a multi-year Head and Shoulders pattern or is this just consolidation?
FITB
entry:29
stop:23.35
 

Attachments

  • FITB.jpg
    FITB.jpg
    100.7 KB · Views: 231
Hey! This is great! Could you explain what you mean by multi-year head and shoulders pattern please?
 
Sure! I just meant a head and shoulders pattern that forms over several years ( attached image with it labeled)
The question is if I've correctly identified it, OR if it will go higher, since the MA 50 crossed the MA 200, and volume, which is bullish
 

Attachments

  • RS1.jpg
    RS1.jpg
    103.3 KB · Views: 222
Yes, there is a H&S on the long-term daily chart, with the left shoulder about February 2017, and the head (also a double top) across March and May 2018.

It could take 6-9 months before the pattern solves and either breaks down or shows a definite failure of the H&S - they don't always break down.

For me that's a very very long time to wait for a trading outcome but nowhere near long enough for an investment outcome.

Meanwhile your stop-loss is at -19%, about twice the maximum that is generally taught for investors and 10 times the maximum suggested for traders.

Are you very confident of your strategy and this share's place in it?
 
Thank you tomorton!
Are you very confident of your strategy and this share's place in it?
actually not really, hence I asked about whether or not it was indeed a H&S - o well, I now closed it with a nice 300usd profit- will try to find something safer and more long-term
Thanks for your advice - I will continue searching and post new stuff here. I really feel like the thing I was missing after reading so much /watching youtube videos was actual feedback
 
You're very welcome. I didn't want to just pour cold water on your first effort. But a plan for all eventualities is a must. There are only four outcomes - price goes up fast, or price goes up slow, or price goes down slow, or price goes down fast - so it won't be impossible to plan for all four.

But you need to work out what you are doing - trading or investing. Both can pay but each needs a different plan.

Why not post up your shortlist of possible next targets?


PS: Keep an eye on the main indices too, not just the brilliant individual stocks you pick. If the big banks decide to cut global risk quickly, they tend to sell every US stock very very fast, including the good as well as the bad.
Good luck.
 
tomorton - that's more or less my entire purpose for being here is to be double - checked ( my biggest issue I found is that I sometimes tend to be too over entusiastic about some stocks )


265290


My next buy recommendation is ADBE, with a stop loss at around 225
Reasons: MA 50 crossed MA 200, both MA's are moving up
the stock was previously in a correction/consolidation phase and now seems poised to run up, with nice volume spikes and a good RSI

possible risks I see: the MA 200 is still moving up, however not at such a nice angle as before: could the current leg of april and july be the first part of a head?

265291
 
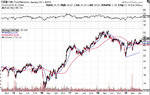
Its certainly in an uptrend but looks like its now run into a consolidation zone after the steep and gappy rise from a month back. A clue is the two recent inside daily bars, suggesting indecision between buyers and sellers. TA theory says it should continue the uptrend higher from here - which it probably will - but when? A week? 2 weeks? 6 weeks? This consolidation might take some time to work out, so many traders would be watching from the sidelines for a break-out and entering then. Or setting a buy order above a suitable high price and going off to maybe find something more energetic right now.

But either way, this is buying at a (relatively) very high price. The share is over 10% up from the last consolidation. Many would want to see a pull-back first, and buy in as the pull-back reverses back into the uptrend.

There'll be a number of ways of playing this.

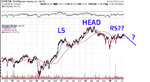
The Dow incidentally shows a very similar recent pattern and similarly looks a bit "toppy", maybe due for a correction. Which is neither good nor bad, but is probably an indication that whatever TA you do for the Dow should be applicable to ADBE in the short-term. Also means if you're thinking of buying an additional stock, check it doesn't correlate closely with the Dow as well or you end up with effectively a double-sized position before you know it.
 
thanks tomorton! I've revised my scanning criteria - Here are my next attempts

265311

CPA with a stop at around 77. The MA200 crossed MA50, RSI has a nice uptrend. It's in the Services sector, which is overall quite strong

might repeat the pattern of 2016-2019. the volume spikes are a bit weak though compared to the 2016 ones


265312


CFR ( short). target at around 55. Buy stop at around 110. RSI is in a downtrend, there seems to be a H&S pattern developing, MA50, MA200 are entering a downtrend. It's in the Financials sector which is not too strong but not too weak either.
 
Last edited:
CFR has results scheduled to be released today and made a serious 3% rise yesterday, breaking out of recent consolidation and closing above the preceding downtrend channel. Its perhaps 50/50 whether some big player in this stock is wanting to accumulate shares or drive the price up so as to short them at an unsupportable level.

Do take out some time to have a look at thepatternsite.com. Thomas Bulkowski has done some of the most thorough research into chart patterns.
 
Thanks tomorton, I will have a look!
What about the 2 stock picks - is the overall logic valid?


Well, I'm not clear whether you have a trading plan or an investment plan.

That said, CPA is as good as any other chart, I know nothing of the company or its' sector.

The CFR looks worrying. Recent consolidation, not falling price, followed by a single session over-sized price rise. I'd like to wait for the dust to clear, and to definitely await the firm's results.
 
oops, I should have been more clear - this is for investing ( roughly 1-2 years)


yes, as I mentioned it's for shorting :)


Many people do invest for 1-2 years so you're not alone by any means but most investors don't have an exit plan that comes form the same data as their entry plan - charts and fundamentals. I've seen many people buy shares and put off any decision as to what to do with them until the anniversary rolls around, and then the next one. Otherwise, they might be scared out by a sudden unexpected price rise. I wonder if investing for 1-2 years is really long enough but this game is mostly a mystery to me anyway.

Yes, CFR is your shorting selection and its from that point of view that this chart looks so unclear.
 
Top