Moving Averages, the good, the bad and the ugly

hb7of9

Junior member
Messages
43
Likes
4
This is going to be a long post, it relates to the efficacy of Moving Averages, (MA's).

I have been fascinated with MA's for about a year, and have most likely spent more than a couple hundred hours investigating them.

It's so easy to find systems based on MA's, whether it be simple, double, triple or C.O.M.A (correct order moving average), systems..

There are literally hundred of videos on youtube.com, showing great examples of how to become the next Buffet using some basic MA.

But do they really work:?: - and by work I mean significantly beat the growth of an index, like SP500, NASDAQ or Russel2000.

Let's see...

I found this thread
http://www.trade2win.com/boards/trading-software/152456-moving-average-crossover-backtester.html

and deiced to test different MA's that I have found to deliver significant results on http://www.zignals.com/, and http://www.tradingblox.com/.

I selected 52 complelty randomly chosen tickers, and tested their performance, going back 5 years, using the movingaveragebacktester.com site.

7MpcTh.png


I have colored all total return cells, for the 5 year period that are under 100% green, because that would equate to less than 20% annually. Which is a joke.

The conclusion for each of the 10 different moving average combinations is as follows.

http://i.cubeupload.com/KhuoO3.png

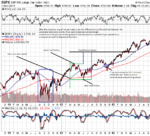
So, using these moving averages, purely from a technical perspective, we can see that 65 short combined with a 115 long delivered the best results over a 5 year period - 21% YOY.

But how does that compare to just buying an index.
SP500 delivered 17.84% per annum
NASDAQ delivered 27.61% per annum

Because there are more risks with individual stocks, we diversify and this increases our trading fees, so with trading fees I would argue that it just buying the index would have been an easier and better bet.

x91ew.png


x6iv9.png


These are not the only moving averages I have tested, other tested included, smoothed, weighted, delayed (TSF), etc. moving averages.

If we compare the best yielding MA 65/90 to buy and hold on the First Trust NASDAQ-100 Equal Weight Idx (QQEW), we again see that buy and hold outperformed.
139% versus 108%, over the 5 years.

This really makes me wonder, how do you trade using MA's?

Does it mean using FA and TA in combination, but is difficult because you have to wait for crossovers, or just use a single MA to serve as a trend line, which also means that MA's just become a confirmation and mayhap stop loss tool.

Or does it mean that MA's can work, but tend to work best on less volatile stocks and longer MA's?

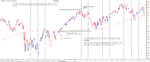
I came accross research on SMATrader.com, which indicated that longer double cross SMA's can significally outperform the market.

His test was conducted over 15 years data on the DAX and SP500.

2d0i2rp.png
[/IMG],

It's pretty clear from his work that, there are MA's that deliver good results (twice the growth over 15 years), with two clear triangles being visible. 100 for the short SMA and between 200 to 300 on the long SMA seems to deliver very good results.

My problem with that is waiting 3 years for a trade signal.
 
Last edited:
  • Like
Reactions: WR1
But do they really work:?: - and by work I mean significantly beat the growth of an index, like SP500, NASDAQ or Russel2000.
Hello hb.
Can you tell me what sort of entry and exit ideas you applied to ma signal to get your results? Ie you enter at the close / on pull back / on a breakout. Where was the exit?. When the trend reversed at close? at target?

No reason why you cant use a single ma to define a trend. imo is probably the simplest way.

Cheers
D
 
I've used, and been fooled by, moving averages more times than I can remember, but the same can be said for any other point on a chart. All you are doing is using a reference point to get into the market. The question is

Is it a point of entry that works more times than it does not?
 
. . . The question is
Is it a point of entry that works more times than it does not?
Hi Split',
Perhaps you're going to elaborate on this in a future post or perhaps you are alluding to something that I'm overlooking. If not, your question isn't an especially significant one IMO, not least because as we all know, some of the most successful traders have batting averages well below 50%.

In my view, a more useful question to ask would be: 'can you distinguish between the times when MAs offer a reliable insight into the state of the market and when they don't?' That way, even if they only 'work' 30% of the time, if you are able to isolate that 30% and ignore the remaining 70% of signals - then you'll be on to something. As the famous quote by John Wanamaker says: "Half the money I spend on advertising is wasted; the trouble is I don't know which half." And so it is with traders and indicators. It's not how often indicators work or fail that matters, it's the trader's ability to distinguish between the two in advance of taking the trade that counts. That's why scientific studies of indicators are, generally, flawed from the outset. They have no way of assessing the trader and the trader's ability (or inability) to determine the probability of a signal from an indicator (a moving average in this case) being a good'n and taking it or, alternatively, being a bad'n and passing it up.

No disrespect intended towards the OP and his studies but, IMO, most of the statistics people come up with about indicators are at best pretty meaningless and at worst grossly misleading. Their effectiveness is governed almost entirely by the individual trader and how they use said indicator, rather than by any inherent quality of the indicator itself. As always, just my $0.02 worth!
Tim.
 
Hello hb.
Can you tell me what sort of entry and exit ideas you applied to ma signal to get your results? Ie you enter at the close / on pull back / on a breakout. Where was the exit?. When the trend reversed at close? at target?

No reason why you cant use a single ma to define a trend. imo is probably the simplest way.

Cheers
D

Hi Darktone,

I hope I understood you correctly and address your question.

For the double cross MA strategy, entry is when the short moving average crosses above the long MA, and exit is the opposite.

The base strategy does not apply any profit targets, it just uses MA cross as an exit indicator. However, this is inefficient, because as is discussed in various research papers. It has been shown that profit reliability can be doubled if, the trade is exited when the price crosses below the short MA, instead of waiting for the short MA to cross the long.

As for using a single MA, yes simple it is, and I do love simple. Unfortunately I and others and I have ran the numbers and it is not as efficient as a double. Also SMA works better than EMA, which is counter intuitive as EMA's should theoretically reflect market sentiment faster. I am not sure what the reason for this is.
 
Hi Split',
Perhaps you're going to elaborate on this in a future post or perhaps you are alluding to something that I'm overlooking. If not, your question isn't an especially significant one IMO, not least because as we all know, some of the most successful traders have batting averages well below 50%.

In my view, a more useful question to ask would be: 'can you distinguish between the times when MAs offer a reliable insight into the state of the market and when they don't?' That way, even if they only 'work' 30% of the time, if you are able to isolate that 30% and ignore the remaining 70% of signals - then you'll be on to something. As the famous quote by John Wanamaker says: "Half the money I spend on advertising is wasted; the trouble is I don't know which half." And so it is with traders and indicators. It's not how often indicators work or fail that matters, it's the trader's ability to distinguish between the two in advance of taking the trade that counts. That's why scientific studies of indicators are, generally, flawed from the outset. They have no way of assessing the trader and the trader's ability (or inability) to determine the probability of a signal from an indicator (a moving average in this case) being a good'n and taking it or, alternatively, being a bad'n and passing it up.

No disrespect intended towards the OP and his studies but, IMO, most of the statistics people come up with about indicators are at best pretty meaningless and at worst grossly misleading. Their effectiveness is governed almost entirely by the individual trader and how they use said indicator, rather than by any inherent quality of the indicator itself. As always, just my $0.02 worth!
Tim.

Hi Tim, I agree with what you said,

I don't see much value in the indicator as indicated, most of the 10 combinations did not even come close to just buying and holding. So, the point I am trying to make is that,I don't really think they offer much value, as is. Your comment about the trader being a quintessential factor is interesting, I cannot agree more. Some traders seems to make money, irrespective of what the indicators does, and others will lose money using the exact same thing.

I think this covers the part of, it comes down to the trader, ... Jack Schwager is fond of harping of this.


As for statistics on indicators being pretty meaningless, I tend to disagree with that, I think the numbers allow us to empirically quantify and identify inherit problems with specific indicators, or tendencies in specific market situations, like the .com crash. Our trading system or frameworks need an edge, I think analyzing systems is will tell use what the probabilities involved are.

If not for that, I might have been inclined to believe that most MA systems that are so often promoted on youtube, actually work.

As for this very good question
"'can you distinguish between the times when MAs offer a reliable insight into the state of the market and when they don't?'[/I] That way, even if they only 'work' 30% of the time, if you are able to isolate that 30% and ignore the remaining 70% of signals - then you'll be on to something"

I think that if longer SMA cross is used, and as is indicated by the triangles, with the pre-exit formula, then it is very likely to deliver good results. That will surely remove 70% of the fluff signals, but as the conclusion states it will mean waiting ages.

or.. 3 trades in 3 years.

r9rdc4.png
 
Last edited:
Hi Darktone,

I hope I understood you correctly and address your question.

For the double cross MA strategy, entry is when the short moving average crosses above the long MA, and exit is the opposite.

The base strategy does not apply any profit targets, it just uses MA cross as an exit indicator. However, this is inefficient, because as is discussed in various research papers. It has been shown that profit reliability can be doubled if, the trade is exited when the price crosses below the short MA, instead of waiting for the short MA to cross the long.

As for using a single MA, yes simple it is, and I do love simple. Unfortunately I and others and I have ran the numbers and it is not as efficient as a double. Also SMA works better than EMA, which is counter intuitive as EMA's should theoretically reflect market sentiment faster. I am not sure what the reason for this is.
Thanks. Im with timsk in that its mostly down to the trader. The ma crossover imo is the method with most lag (which could be a good or a bad thing on how you enter/where the last price is at the cross).
Imo its the traders job to aim to get in nearer the entry price and exit nearer the best exit price.
I hope i get that across in the attached.

I also believe that there is no knowing as to which signals will be good or not, nor is it possible to know how far a trend will run. The best we can do is aim at extreme entry/exit points after 'a' signal is given and manage our losses as best we can. imo

Cheers
D

167704d1383499785-moving-averages-good-bad-ugly-spx.png
 

Attachments

  • spx.png
    spx.png
    260.1 KB · Views: 2,429
Last edited:
MA crossovers - ???

The real power of moving averages lies in cycle analysis of any given instrument - study the work of Hurst and Millard.
 
Thanks for your input darktone, your chart certainly makes a lot of sense, and gets the point across, I used the same technique on multiple instruments.

Something else I used to I like doing when using a single MA's, drawing support and resistance lines while looking for a drop in momentum. My father always drilled those into me head.

14wbxvc.png
,
 
Magic moving averages -Bowlocks

Have you all noticed how you all talk about what has happened in relation to moving averages. Try predicting where price will move in the future using your moving average crosses -not so good eh !

Hate to **** on your parade but if ma methods worked everyone would use them. The majority of your trading success (or for most people on T2W -failure) is affected, in the main,by what goes on in your head. This has been discussed ad-nauseum on this site so often, yet one still sees people popping up with their version of the holy grail of trading with magic indicators, such as the moving average,I consider it pointless to enlarge on the point under discussion(moving averages).
Hey - you will have losses, and losing runs, but it's how you manage them (among other things) that makes you profitable or otherwise.:rolleyes:
 
Interesting thread

Ma's are much discussed at t2w and are most newbies First port of call

And rightly so ....as they are the simplest indicators
To understand once price principles have been learnt and are very useful for perspective on an instruments price in any tf

But.....Like all indicators they need to be used with full knowledge of their pros and cons......

So I am not surprised to see the poor performance of the indicator used in isolation

So caveat emptor for anyone using it as too much of a pure trading signal/tool

N

Very true. NVP's post should be read carefully and kept in the forefront of the new traders mind. Caveat emptor indeed(y)
 
I couldn't make the sort of returns I do without moving averages.

Which is why I'm thinking of ditching them.
 
Just kidding. As NVP suggested and as seconded by Neil, beauty is in the eye of the beholder - there area as many ways to use moving averages as there are pointless analyses of the relative efficacy of systems based purely on using them alone.

While I am sure there are many experienced traders who do not use them, there are likely as many that do. They are the least reconstituted of all time & price indicators and therefore the least subject to noise.

The only thing which even seasoned moving averages users tend to so which is mathematically incorrect - and something I do too even though I know I shouldn't - is to plot them without shift. A mathematically correct moving average should be plotted one half cycle back. Of course, this isn't a very attractive proposition when you're trading a half-cycle further forward - on the current bar - but there you go.

As a aside, this is why the ichimoku is possibly one of the better moving average derivatives as it does precisely this.
 
The only thing which even seasoned moving averages users tend to so which is mathematically incorrect - and something I do too even though I know I shouldn't - is to plot them without shift. A mathematically correct moving average should be plotted one half cycle back. Of course, this isn't a very attractive proposition when you're trading a half-cycle further forward - on the current bar - but there you go.

The first step in using them meaningfully :)
 
Have you all noticed how you all talk about what has happened in relation to moving averages. Try predicting where price will move in the future using your moving average crosses -not so good eh !

Hate to **** on your parade but if ma methods worked everyone would use them. The majority of your trading success (or for most people on T2W -failure) is affected, in the main,by what goes on in your head. This has been discussed ad-nauseum on this site so often, yet one still sees people popping up with their version of the holy grail of trading with magic indicators, such as the moving average,I consider it pointless to enlarge on the point under discussion(moving averages).
Hey - you will have losses, and losing runs, but it's how you manage them (among other things) that makes you profitable or otherwise.:rolleyes:
Neil, while agree with your its all about the trader and how you manage losses points (esp the latter). But why do you see an ma cross as predictive? In the examples ive shown they are hardly that imo. When a price trades through an ma all it means to me is that it is trading stronger or weaker than its average price. For me that means jump on for minimal costs and hope that the situation continues to my target. Just a line in the sand to have a go at.
The advantage of an ma for me is that it takes the predictive elements and ego out of the directional equation. A whole lot less to think about when trying to manage your position.
 
Last edited:
Just kidding. As NVP suggested and as seconded by Neil, beauty is in the eye of the beholder - there area as many ways to use moving averages as there are pointless analyses of the relative efficacy of systems based purely on using them alone.

While I am sure there are many experienced traders who do not use them, there are likely as many that do. They are the least reconstituted of all time & price indicators and therefore the least subject to noise.

The only thing which even seasoned moving averages users tend to so which is mathematically incorrect - and something I do too even though I know I shouldn't - is to plot them without shift. A mathematically correct moving average should be plotted one half cycle back. Of course, this isn't a very attractive proposition when you're trading a half-cycle further forward - on the current bar - but there you go.

As a aside, this is why the ichimoku is possibly one of the better moving average derivatives as it does precisely this.
:confused: I think you might be thinking too much PB!
 
Last edited:
It seems to me that most crosses coincide with a breakout, anyway. It can be used as a confirmation. Once the trend is in progress the longer averages can provide a useful indication of where to re-enter, or add to a trade. The shorter average might be found useful for noting loss of momentum and a spot to take profits.

Entering, though, on a cross? I am, usually. in by then, for the above reason.

Another problem with crossovers is the whipsaw factor in a ranging market and it is one that happens a lot.
 
Last edited:
Top