What is the correlation between different FX pairs and how can it be measured?
As a Forex trader, it is necessary to be constantly aware of the characteristics of the currency market. Without knowledge of the basic tendencies of any given currency pair, traders are exposing themselves to excessive amounts of risk. One of the most beneficial pieces of knowledge for a Forex trader to be armed with is the historical correlation between currencies. Understanding this relationship will not only allow traders to hedge positions, but it may also give them an edge when it comes to entering a trade.
The term correlation is used to describe the relationship between two related variables and can be expressed as an integer between +1 and -1. A correlation of +1 is referred to as a perfect correlation and suggests that a 1 pip move in one currency should also see a 1 pip move in another currency in the same direction. A -1 correlation implies that the two currencies move in the same magnitude in opposite directions. If two variables have a correlation of zero, they move independent of one another and can be considered to have no relationship.
As you can imagine, knowing the exact relationship of one currency with another is priceless. Many traders compare overlay charts in order to measure correlation, however it is far more precise to actually run a calculation in which you can get an exact figure. Additionally, whether traders would like to admit it or not their judgment often contains a bias making it unwise to "eyeball" a chart in order to determine correlation. The simplest way to measure correlation is using Microsoft Excel's Data Analyis Toolpak.
Microsoft Excel is capable of analyzing the correlation between two currency pairs at the click of a mouse. The difficulty in the analysis lies within obtaining the data, rather than analyzing it. If you have access to historical data, you can simply copy and paste the closing prices into respective columns in Microsoft Excel. When I say closing price, it can be based on daily or intraday data as long as the beginning point and ending point are identical for the two currency pairs being compared.
After compiling the data into two separate columns, make sure that your Excel software is prepared for statistical analysis by clicking on the Tools tab and identifying the Data Analysis option on the drop down menu. If you do not see Data Analysis as an option you must load the data analysis tool pak by choosing Add-Ins on the Tools menu and clicking on Analysis Toolpak and follow the instructions.
Once selected, the data is ready to be analyzed for correlation. Clicking on the Tools tab will reveal a drop down menu, which should now have Data Analysis as an option. Clicking on Data Analysis will bring up a window in which you will be prompted to enter an "input range". In other words, which data would you like to be considered in the analysis? Make sure that you have chosen that columns rather than rows group the data. Click and drag your mouse over the data that you would like to be involved in the calculation and press "OK" in the window. The result will be a table, providing the correlation coefficient to the relative currency pairs.
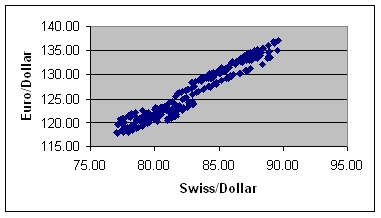
The term correlation coefficient is used to represent the numerical representation of the relationship between the two variables. As mentioned before, the range of the coefficient can be between +1 and -1 with +1 representing a perfectly positive correlation and -1 identifying a perfectly negative correlation. In the example below, you can see that during the sample period the Swiss and the Euro have a positive correlation of .9667. This is no surprise; it is a well-known fact that these particular currencies move in tandem.
If you understand concepts better when they are visualized, you could plot the data into a chart by clicking on the insert tab and selecting Chart. A plotted chart best represents correlation. If the chart reveals an inclining diagonal line, the two variables are positively correlated. If the chart forms a declining diagonal line the variables are negatively correlated. f the chart forms a declining diagonal line the variables are negatively correlated. A random plot in which no particular pattern is formed indicates that there is no correlation between the variables.
Swiss/Dollar Euro/Dollar
79.47 121.53
79.37 121.58
79.43 121.33
80.53 122.68
79.84 121.71
80.52 122.28
80.51 122.18 79.33 120.25
79.21 120.37
78.88 120.19
78.82 120.45
79.09 120.78
80.01 122.08
80.13 122.55
78.55 120.38
77.67 119.19
Swiss/Dollar Euro/Dollar
Swiss/Dollar 1
Euro/Dollar 0.966772227 1
To reiterate, correlation is simply a tool that can be used to improve trading results and should be seen as guidance rather than fool proof. Although understanding the nature of the currency markets is imperative, you must also retain respect for the market.
As a Forex trader, it is necessary to be constantly aware of the characteristics of the currency market. Without knowledge of the basic tendencies of any given currency pair, traders are exposing themselves to excessive amounts of risk. One of the most beneficial pieces of knowledge for a Forex trader to be armed with is the historical correlation between currencies. Understanding this relationship will not only allow traders to hedge positions, but it may also give them an edge when it comes to entering a trade.
The term correlation is used to describe the relationship between two related variables and can be expressed as an integer between +1 and -1. A correlation of +1 is referred to as a perfect correlation and suggests that a 1 pip move in one currency should also see a 1 pip move in another currency in the same direction. A -1 correlation implies that the two currencies move in the same magnitude in opposite directions. If two variables have a correlation of zero, they move independent of one another and can be considered to have no relationship.
As you can imagine, knowing the exact relationship of one currency with another is priceless. Many traders compare overlay charts in order to measure correlation, however it is far more precise to actually run a calculation in which you can get an exact figure. Additionally, whether traders would like to admit it or not their judgment often contains a bias making it unwise to "eyeball" a chart in order to determine correlation. The simplest way to measure correlation is using Microsoft Excel's Data Analyis Toolpak.
Microsoft Excel is capable of analyzing the correlation between two currency pairs at the click of a mouse. The difficulty in the analysis lies within obtaining the data, rather than analyzing it. If you have access to historical data, you can simply copy and paste the closing prices into respective columns in Microsoft Excel. When I say closing price, it can be based on daily or intraday data as long as the beginning point and ending point are identical for the two currency pairs being compared.
After compiling the data into two separate columns, make sure that your Excel software is prepared for statistical analysis by clicking on the Tools tab and identifying the Data Analysis option on the drop down menu. If you do not see Data Analysis as an option you must load the data analysis tool pak by choosing Add-Ins on the Tools menu and clicking on Analysis Toolpak and follow the instructions.
Once selected, the data is ready to be analyzed for correlation. Clicking on the Tools tab will reveal a drop down menu, which should now have Data Analysis as an option. Clicking on Data Analysis will bring up a window in which you will be prompted to enter an "input range". In other words, which data would you like to be considered in the analysis? Make sure that you have chosen that columns rather than rows group the data. Click and drag your mouse over the data that you would like to be involved in the calculation and press "OK" in the window. The result will be a table, providing the correlation coefficient to the relative currency pairs.
The term correlation coefficient is used to represent the numerical representation of the relationship between the two variables. As mentioned before, the range of the coefficient can be between +1 and -1 with +1 representing a perfectly positive correlation and -1 identifying a perfectly negative correlation. In the example below, you can see that during the sample period the Swiss and the Euro have a positive correlation of .9667. This is no surprise; it is a well-known fact that these particular currencies move in tandem.
If you understand concepts better when they are visualized, you could plot the data into a chart by clicking on the insert tab and selecting Chart. A plotted chart best represents correlation. If the chart reveals an inclining diagonal line, the two variables are positively correlated. If the chart forms a declining diagonal line the variables are negatively correlated. f the chart forms a declining diagonal line the variables are negatively correlated. A random plot in which no particular pattern is formed indicates that there is no correlation between the variables.
Swiss/Dollar Euro/Dollar
79.47 121.53
79.37 121.58
79.43 121.33
80.53 122.68
79.84 121.71
80.52 122.28
80.51 122.18 79.33 120.25
79.21 120.37
78.88 120.19
78.82 120.45
79.09 120.78
80.01 122.08
80.13 122.55
78.55 120.38
77.67 119.19
Swiss/Dollar Euro/Dollar
Swiss/Dollar 1
Euro/Dollar 0.966772227 1
To reiterate, correlation is simply a tool that can be used to improve trading results and should be seen as guidance rather than fool proof. Although understanding the nature of the currency markets is imperative, you must also retain respect for the market.
Last edited by a moderator: