stillkicking
Member
- Messages
- 71
- Likes
- 17
Hello to all. OK, so the title is rather pretentious. Take it with a grain of salt.
Been awhile since I've posted. I have something to share with those day traders who may be struggling out there. This is a day trading pattern I have been back testing for the past few weeks. It seems to bear out as a credible pattern almost all the time. It's simple to understand and easy to implement. All it takes is patience on your part and the ability to keep your eyes on several stocks at the time time... looking for the setup I will identify, here.
To make this work, you will need to prepare your charting the way I have mine on ThinkOrSwim. I have three charting lines or "studies" as ToS calls them. They are VWAP, Simple Moving Average and Moving Average Exponential. Add these to all the stock charts you will be watching on a given morning. They are essential to using this system!
I have the lines colored as follows:
Yellow = MovAvgExponential (Close, 9, 0, no)
Blue = SimpleMovingAvg (Close, 20, 0, no)
Purple = VWAP
You will also need to add StochasticFull and MoneyFlow to the bottom of your main trading chart. These both work to confirm the direction of the market and help you to time when to get in and out. You can see my settings for each one in the picture, below.
Finally, set your chart to one minute bars.
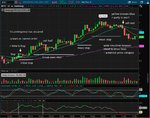
The first chart, below, is from today (6/19/20) and is representative of exactly how this pattern plays out.....most every time! I have marked it up to show how the pattern sets up and your trading moves. Study it closely and you will see how easy and effective this day trade can can be, if you wait for the set up and are not greedy.
The first thing to look... and wait... for is the convergence of the three studies (I will call them lines going forward). When all three become extremely close to each other, it signals the potential for this pattern to set up. However, the lines have to be in the correct order. That is, yellow over blue over purple in that exact order. If the order is wrong, the setup will not work out.
Look at 10:10AM on the chart and you will see the lines make the correct order for the first time this morning. Look at the volume chart, stochastic chart and money flow chart underneath and all are clearly indicating a potential upward trend.

This is your buy signal. Set your stop at the bottom of the nearest red candle and get set for the ride!
At around 10:20AM it might be a good time to sell a portion and take some profit. Move the stop up to break even.
Watch the lines and notice how they track each other but do not converge. This is a good sign and it means there is more upside to come.
Note the wide deviation between VWAP and the other two lines. The wider this gets the more of a chance a price collapse is eminent.
I would be moving my stop up all the while and watching for a clear signal things are getting long in the tooth. That comes at around 11:00AM when the yellow line crosses the blue line. This is the signal to sell and get out. The pattern has crashed and the trade is over.
This morning, I was watching six stocks. GLBS, BYFC, LITB, UONEK, GNUS and PT. The only one to present this pattern was BYFC. For me, it would have been the clear stock to trade and, had I done that using this system, I would have made some easy money with almost no risk.
I need to wait for around 9:50 or so to find this pattern. It rarely, if ever, occurs before then. That first set up in the early morning of regular trading is usually the best. Once in, I find the pattern is only going to last for 20 to 50 minutes and then it will fail. ToS has phone alerts so I can set them to trigger on price levels of the VWAP. That gives me advanced notice to check a particular stock to see if the pattern is about to occur.
Here are some more examples from the past week. The set up is exactly the same as is the result. Note how both StochasticFull and MoneyFlow confirm the entry and exit points in all cases giving you clear buy and sell signals. This set up occurs over and over if you are savvy enough to know what to look for. Now you do!


Check some stocks you trade yourself and look for this exact pattern. I think you will find that, if the setup matches what I have told you, the end result will be identical.
BTW: Before you poo-poo this as nothing more than the basic "first candle to make a new high" trading setup, note the fact that the trade goes on for a extended period of time before failing. Using this set up correctly rarely results in a false breakout. Look at either of these stocks and you will see that, unless the lines are in the correct order, the common breakout pattern usually fails rather quickly.
Happy trading
Been awhile since I've posted. I have something to share with those day traders who may be struggling out there. This is a day trading pattern I have been back testing for the past few weeks. It seems to bear out as a credible pattern almost all the time. It's simple to understand and easy to implement. All it takes is patience on your part and the ability to keep your eyes on several stocks at the time time... looking for the setup I will identify, here.
To make this work, you will need to prepare your charting the way I have mine on ThinkOrSwim. I have three charting lines or "studies" as ToS calls them. They are VWAP, Simple Moving Average and Moving Average Exponential. Add these to all the stock charts you will be watching on a given morning. They are essential to using this system!
I have the lines colored as follows:
Yellow = MovAvgExponential (Close, 9, 0, no)
Blue = SimpleMovingAvg (Close, 20, 0, no)
Purple = VWAP
You will also need to add StochasticFull and MoneyFlow to the bottom of your main trading chart. These both work to confirm the direction of the market and help you to time when to get in and out. You can see my settings for each one in the picture, below.
Finally, set your chart to one minute bars.
The first chart, below, is from today (6/19/20) and is representative of exactly how this pattern plays out.....most every time! I have marked it up to show how the pattern sets up and your trading moves. Study it closely and you will see how easy and effective this day trade can can be, if you wait for the set up and are not greedy.
The first thing to look... and wait... for is the convergence of the three studies (I will call them lines going forward). When all three become extremely close to each other, it signals the potential for this pattern to set up. However, the lines have to be in the correct order. That is, yellow over blue over purple in that exact order. If the order is wrong, the setup will not work out.
Look at 10:10AM on the chart and you will see the lines make the correct order for the first time this morning. Look at the volume chart, stochastic chart and money flow chart underneath and all are clearly indicating a potential upward trend.
This is your buy signal. Set your stop at the bottom of the nearest red candle and get set for the ride!
At around 10:20AM it might be a good time to sell a portion and take some profit. Move the stop up to break even.
Watch the lines and notice how they track each other but do not converge. This is a good sign and it means there is more upside to come.
Note the wide deviation between VWAP and the other two lines. The wider this gets the more of a chance a price collapse is eminent.
I would be moving my stop up all the while and watching for a clear signal things are getting long in the tooth. That comes at around 11:00AM when the yellow line crosses the blue line. This is the signal to sell and get out. The pattern has crashed and the trade is over.
This morning, I was watching six stocks. GLBS, BYFC, LITB, UONEK, GNUS and PT. The only one to present this pattern was BYFC. For me, it would have been the clear stock to trade and, had I done that using this system, I would have made some easy money with almost no risk.
I need to wait for around 9:50 or so to find this pattern. It rarely, if ever, occurs before then. That first set up in the early morning of regular trading is usually the best. Once in, I find the pattern is only going to last for 20 to 50 minutes and then it will fail. ToS has phone alerts so I can set them to trigger on price levels of the VWAP. That gives me advanced notice to check a particular stock to see if the pattern is about to occur.
Here are some more examples from the past week. The set up is exactly the same as is the result. Note how both StochasticFull and MoneyFlow confirm the entry and exit points in all cases giving you clear buy and sell signals. This set up occurs over and over if you are savvy enough to know what to look for. Now you do!
Check some stocks you trade yourself and look for this exact pattern. I think you will find that, if the setup matches what I have told you, the end result will be identical.
BTW: Before you poo-poo this as nothing more than the basic "first candle to make a new high" trading setup, note the fact that the trade goes on for a extended period of time before failing. Using this set up correctly rarely results in a false breakout. Look at either of these stocks and you will see that, unless the lines are in the correct order, the common breakout pattern usually fails rather quickly.
Happy trading
Attachments
Last edited: