Max Strategy Drawdown %0.43

CurrencyKing

Newbie
Messages
9
Likes
0
I'd just like to share the idea that led me to making a successful trading system.I am not here to share my actual system but ideas to people who are serious about developing a good system.

All the indicators I see available in standard charting packages are lagging. I don't know how some one can make some real money with something that lags. You never know,as soon as you enter,the market might turn on you before your indicator indicates it (because of the lag). You need to start thinking outside the box,basic indicators are a no-no.

You could try trading in realtime instead of waiting for close of price. Of course this would require knowing what you are doing and why.

If you have an idea then get yourself a programming book and program your idea. Each person is different,and you need to study the market,learn how it works,feel the market, be the market.

Another point i'd like to address is market filtering. There are many ways to filter market price. The more you can filter the price without adding lag,the better of a chance you have at making a successful strategy. When I talk about filtering, I don't mean averaging the bars,this is filtering but its a bad way to filter price. Sit down and think of different ways you can do this, instead of trying to add indicators and see what happens when some lines cross.

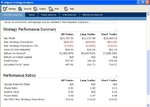
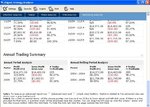
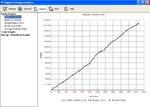
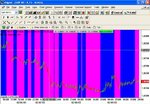
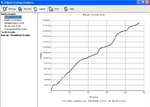
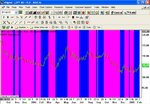
After putting all your ideas together, I am sure you can come up with a successfull strategy. I will share some results with you guys and show you what planning and deep thinking can bring. Sorry I cannot disclose my system, I have put alot of hard hours into it,and that's just me. I am thinking of maybe marketing my system to some serious traders, or maybe not. I am happy trading it and making really good money. I actually trade for a living now and I will be writing some trading books with some good info to share.I will make a new post with some pictures of some results and charts.
 
GBP 15 min. Some backtests results and chart
 

Attachments

  • backtest1.JPG
    backtest1.JPG
    72 KB · Views: 573
  • backtest2.JPG
    backtest2.JPG
    102.1 KB · Views: 543
  • backtest3.JPG
    backtest3.JPG
    78.4 KB · Views: 515
  • GBP - 15 MIN.JPG
    GBP - 15 MIN.JPG
    91.3 KB · Views: 591
JPY Daily Sample chart and equity curve
 

Attachments

  • equity curve.JPG
    equity curve.JPG
    68.8 KB · Views: 474
  • JPY - Daily.JPG
    JPY - Daily.JPG
    84.8 KB · Views: 432
hmm, high success rate 96% implies small target price and wide/non-existent stop

backtest only over a small number of trades..

wait a moment while i knock one of these up. shouldnt take too long.

give it a few 1000 trades, and then its worthwhile..

as then you may hit The Big One, which can cause you to start sweating from the eyeballs.

FC
 
Last edited:
also had another look at the stats in slightly more detail.


150 odd trades over the course of a year.. 2 every 3 days...


looks like holding losers until they come good..


perhaps the entry criteria are fading breaks of bollinger bands? sigma bands? MA envelopes?
 
FetteredChinos said:
also had another look at the stats in slightly more detail.


150 odd trades over the course of a year.. 2 every 3 days...


looks like holding losers until they come good..


perhaps the entry criteria are fading breaks of bollinger bands? sigma bands? MA envelopes?

maybe its fading breaks,bollinger bands,sigma bands, ma envelopes, why dont you try it and get the same results as i did???
 
maybe i have and decided that it was a fast way to the poor house..


from what i deduce from the stats, it is probably counter-trend, as they have higher win rates.

secondly it almost certainly has a target price in order to get that kind of "accuracy".

if you could present a backtest from more than 50 trades, i would be impressed.

and i dont mean 51.

;)

FC
 
FetteredChinos said:
maybe i have and decided that it was a fast way to the poor house..


from what i deduce from the stats, it is probably counter-trend, as they have higher win rates.

secondly it almost certainly has a target price in order to get that kind of "accuracy".

if you could present a backtest from more than 50 trades, i would be impressed.

and i dont mean 51.

;)

FC

I most certainly will give you a backtest with as much data as i can get with esignal

And its not counter-trends. Not target price either,its an always in market system.
 
Anyone still using eSignal needs to be able to come up with some profitable systems, just to afford the subscription-fees. :)

CurrencyKing said:
its an always in market system.
Hmmm ... big surprise, I admit. People with an always-in-the-market system can't usually afford eSignal at all ...
 
CurrencyKing, if you're not going to disclose your system (and as you say, why would you) what is it you want to discuss on these boards - the techniques that led you to developing your system - such as filtering?

If so, what do YOU mean by the term filtering?

I filter OUT stocks that don't meet certain criteria.

I filter IN information that's relevant to my purpose (whatever that might happen to be at any point in time).

So we have the exclusive/inclusive filtering mode (just made those terms up).

You can filter on criteria and the criteria generally has to be inherent within the object that's being filtered.

With FX you've got value and time.

So, what are you doing with Value and Time?

What way are you using filtering?
 
FetteredChinos said:
maybe i have and decided that it was a fast way to the poor house..


from what i deduce from the stats, it is probably counter-trend, as they have higher win rates.

secondly it almost certainly has a target price in order to get that kind of "accuracy".

if you could present a backtest from more than 50 trades, i would be impressed.

and i dont mean 51.

;)

FC

If you look at the GBP backtests you could see that in 2004 there were 295 trades (thats only a few months of 2004 by the way),and so far in 2005 there were 157 trades. Surely that's more than 50 trades. If this isnt what you're looking for then please explain. Thanks
 
i was referring to the equity curve, which only seems to have 50 trade on it?

or perhaps i am misreading the graph.

(edit - yes i am actually. i was mixing my instruments.. oo-err)

either way, its irrelevant, as im not sure about your purpose in posting?

do you know a guy called TradeVector? he used to like FX..

actually, i think he was due to be a gazillionaire by now..
 
Last edited:
TheBramble said:
CurrencyKing, if you're not going to disclose your system (and as you say, why would you) what is it you want to discuss on these boards - the techniques that led you to developing your system - such as filtering?

If so, what do YOU mean by the term filtering?

I filter OUT stocks that don't meet certain criteria.

I filter IN information that's relevant to my purpose (whatever that might happen to be at any point in time).

So we have the exclusive/inclusive filtering mode (just made those terms up).

You can filter on criteria and the criteria generally has to be inherent within the object that's being filtered.

With FX you've got value and time.

So, what are you doing with Value and Time?

What way are you using filtering?

What I mean by filtering is viewing the price differently. The price and time will always be there,and it will always be the same,but the way we look at it can be different. For example,look at the different price charts you can use (bar,line,renko,3lb,pnf). Also,a moving average is a type of price filter,but the problem with that is that it lags. So surely there are ways to view price differently that will make it easier to trade.
 
FetteredChinos said:
i was referring to the equity curve, which only seems to have 50 trade on it?

or perhaps i am misreading the graph.

(edit - yes i am actually. i was mixing my instruments.. oo-err)

either way, its irrelevant, as im not sure about your purpose in posting?

do you know a guy called TradeVector? he used to like FX..

actually, i think he was due to be a gazillionaire by now..

Sorry I don't know him. Let's please stay on topic.
 
CurrencyKing said:
What I mean by filtering is viewing the price differently. The price and time will always be there,and it will always be the same,but the way we look at it can be different. For example,look at the different price charts you can use (bar,line,renko,3lb,pnf). Also,a moving average is a type of price filter,but the problem with that is that it lags. So surely there are ways to view price differently that will make it easier to trade.
OK. Still not clear what it is you're suggesting.

If you're wary about giving anything away, why don't you give us an example of a filter you looked at in the early stages of developing your system and discarded. That way, we wont make any financial gain from your comments, but will get a firmer idea what it is you're talking about.

'Types' of bar chart (Renko, Kagi etc.) are well known, but just to plonk them down as 'filter fodder' doesn't really help too much.

There have been (and still are) a few on these boards who attempt the "ME TEACHER / YOU STUDENT) approach, but it has to be said, hasn't gone down too well with members generally in the past. So if you want to develop increased interest/readership in this thread, you might want to consider opening up a little.

We're a needy, greedy lot and like something a little bit more empirical to stir our imaginations.
 
Top