Market Correlation and Variance

1

12WBT

Took up an interest in market correlation back in 2005 when I used to trade share CFD’s with MF Global.

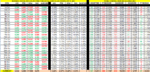
Started collecting the variance on BHP(BLT in London same company) and RIO from London to Sydney. And after a period of time started to go long BHP and RIO in London and short BHP and RIO in Sydney. Or vis versa and sometime’s only one company based on variation. This was all done on a spread sheet which also calculated the variance of the AUD/GBP or GBP/AUD to give the true variance.

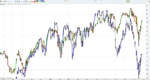
Can be done on a chart but this will not allow for the currency variance. Plus I find excel is a lot more precise in seeing price than a chart.

Stopped trading share CFD’s about 2007/08 when the GFC was on, and short selling was banned in Australia. Ban was for a lot longer period in Australia than the UK. Very hard to trade when the only option to go long when everything is heading south.

In the next post will talk about what instruments you can use in market correlation.
And then go on how I discovered what a member on T2W was using a few years later which I looked at and just broadened that approach. Which I have used every day now few a years now with a couple of other separate trading techniques,

Or you might say I stole and added my thing, well I am in Australia now.:LOL:

And also later on put some spreadsheets up showing market correlation during the year.
And hopefully getting other people talking about this subject, have noticed some posts where people mention using this.
I would say this is no holy grail system and requires thinking and a judgement call when to take a position.
But offers a high probability strategy if you do the work.
 
What can be correlated?

My way of thinking anything over a period of time.
Can be a short period of seconds or a long period of years.

In a market sector you can use correlation of shares in that sector.
Banks, miners, consumer staples, etc or break the sector down say gold miner or silver miner etc.

Market sector against an index in the same country.

Banking sector against the ASX200, last time I looked the weight was about 40%.

Or index against index in the same country FTSE 100 against FTSE 250 or DOW v SP500

Overseas index versus each other KOSPI(South Korea) v Bovespa(Brazil)

Currency pairs versus each other CHF/JPY v USDJPY

Or currency pairs against an index or sector AUD/USD v SP500

Metal prices or crop prices against each other.

So much more can be added bonds, options, etc

All can be done on a chart, but better worked on excel to find the exact variance
 
Good track. I know a hedgie whose flagship discretionary offering specialises in this sort of thing. They do it slightly differently in that they look for arb ops on changes to correlations on the basis that most who are using correlations will be slower to identify or acknowledge the change. Ya only have to look at Murphy's Intermarket Technical Analysis to see just how much things have changed. It's the people who don't watch out for the changes that get smacked the hardest. Servers em right really.
 
Index Variance

Have attached a spreadsheet that I have been using for a few years.
Shows the variance of markets during 2014.

Just looking at the DAX/DOW.
DAX was out performing the DOW at the start of the year.
But now it is 750 points under to DOW.
There would be fundamental reasons for the variance during the year.

Interesting thing this time last year DAX was under over 1000 points to the DOW.
But before year end it made it all up and put some on.

Have some shorter period spreadsheets, but with all the market volatility has put markets out of whack. Makes it harder to judge the shorter variance time frames.
Better to work off the longer time variance.

Will put the short time frames up next time.
 

Attachments

  • Market Correlation.xls
    210 KB · Views: 252
Good track. I know a hedgie whose flagship discretionary offering specialises in this sort of thing. They do it slightly differently in that they look for arb ops on changes to correlations on the basis that most who are using correlations will be slower to identify or acknowledge the change. Ya only have to look at Murphy's Intermarket Technical Analysis to see just how much things have changed. It's the people who don't watch out for the changes that get smacked the hardest. Servers em right really.

Thanks Pat

Not read Murphy's book, but interesting to see that he had to re write the book a decade later because global correlation's had changed.
Make's you wonder on correlation going forward with central banks at unprecedented level's. For me a thing to look at is the bond market.
With all this money sitting on zero or negative rate's. Then these people start trying to sell, who will buy them, bond market crash in waiting.
Will that then send the global index markets even higher.
 
Interesting ......I know that I looked at a lot of stuff from joe ross back in the day

aside from Forex I have always wondered if money could be made trading leading / lagging stocks against sectors and also similarly Sectors against indices.......

interesting indeed
N

http://www.trade2win.com/boards/for...ding-basic-ideas-strategies-2.html#post876398

Thanks NVP

Not read joe ross, but read some of your thread.
The big correlation is the JPY crosses to the global markets.
Money into JPY means money out of the share market.
Not sure if there is a JPY index, like the USD dollar index.
Would be a powerful tool for day trader's.
 
Have attached a spreadsheet that I have been using for a few years.
Shows the variance of markets during 2014.

Just looking at the DAX/DOW.
DAX was out performing the DOW at the start of the year.
But now it is 750 points under to DOW.
There would be fundamental reasons for the variance during the year.

Interesting thing this time last year DAX was under over 1000 points to the DOW.
But before year end it made it all up and put some on.

Have some shorter period spreadsheets, but with all the market volatility has put markets out of whack. Makes it harder to judge the shorter variance time frames.
Better to work off the longer time variance.

Will put the short time frames up next time.

Hi 12WBT,

You have a lot of good information compiled over a period of time. I have been doing something similar since last Feb and coupled with the charts writing numbers down seems to have had a positive effect on the bottom line.

I also use excel and baseline different asset prices and observe differentials in variations over time.

I would strongly recommend this site https://www.mataf.net/en/tools/01-01-correlation

They do the correlation charting for you in the index section. https://www.mataf.net/en/forex-charts/c-index (Then click on the Compare Forex Index tab)

BBand variations with PivotPoints also very useful in identifying S/R and turning levels.

Interesting ones to follow closely imo is the SPX, $, oil, gold and silver. Many an interesting relationships there. Throw in any of your major currencies too & identify leaders and laggards in the moves.


(y)
 
Last edited:
  • Like
Reactions: NVP
Hi 12WBT,

You have a lot of good information compiled over a period of time. I have been doing something similar since last Feb and coupled with the charts writing numbers down seems to have had a positive effect on the bottom line.

I also use excel and baseline different asset prices and observe differentials in variations over time.

I would strongly recommend this site https://www.mataf.net/en/tools/01-01-correlation

They do the correlation charting for you in the index section. https://www.mataf.net/en/forex-charts/c-index (Then click on the Compare Forex Index tab)

BBand variations with PivotPoints also very useful in identifying S/R and turning levels.

Interesting ones to follow closely imo is the SPX, $, oil, gold and silver. Many an interesting relationships there. Throw in any of your major currencies too & identify leaders and laggards in the moves.


(y)

Thanks Atilla for sharing

I have also found data you collect yourself a great help for my trading.

Much more than 3rd party data.
 
Have attached a spreadsheet that I have been using for a few years.

Just looking at the DAX/DOW.
DAX was out performing the DOW at the start of the year.
But now it is 750 points under to DOW.
There would be fundamental reasons for the variance during the year.


Just thought would also show the DAX/DOW on a chart.

You can see that DOW is up 1.3% and DAX is down about 6.4% for 2014

So this will give you a total variance of 7.7% across 2014 on excel I currently have 7.9% DAX under by 757 points to DOW

Would vary slightly to the cash market
 

Attachments

  • DAX.PNG
    DAX.PNG
    142.9 KB · Views: 287
Have attached a spreadsheet that I have been using for a few years.

Just looking at the DAX/DOW.
DAX was out performing the DOW at the start of the year.
But now it is 750 points under to DOW.
There would be fundamental reasons for the variance during the year.


Just thought would also show the DAX/DOW on a chart.

You can see that DOW is up 1.3% and DAX is down about 6.4% for 2014

So this will give you a total variance of 7.7% across 2014 on excel I currently have 7.9% DAX under by 757 points to DOW

Would vary slightly to the cash market

Hi 12WBT, what is the significance of a gregorian calendar year? Have you considered using other dates as day "zero"? 01Apr? 01Jun? 01Oct? Jewish new year? chinese new year?
 
Hi 12WBT, what is the significance of a gregorian calendar year? Have you considered using other dates as day "zero"? 01Apr? 01Jun? 01Oct? Jewish new year? chinese new year?

Hi paszkman

Never looked at that sort of thing, had to google gregorian calendar.

Not sure if they would play a major part.

Think earning, economic and market sentiment are the main drivers.
 
Last edited by a moderator:
Have attached a spreadsheet that I have been using for a few years.

Just looking at the DAX/DOW.
DAX was out performing the DOW at the start of the year.
But now it is 750 points under to DOW.
There would be fundamental reasons for the variance during the year.


Just thought would also show the DAX/DOW on a chart.

You can see that DOW is up 1.3% and DAX is down about 6.4% for 2014

So this will give you a total variance of 7.7% across 2014 on excel I currently have 7.9% DAX under by 757 points to DOW

Would vary slightly to the cash market


hmmmmm - surely this is due to

the relative weighting of industrial sectors in each market
Exchange rate differentials / exposure in each market


although I must admit that Dax does look relatively oversold in this case ..........you would think it should have benefited more from usd strength than it seems

that takes us to the weightings............my dim memory tells me big exposure on the DAX to german manufacturing and heavy industry.........

Would be all those and many more.
2 keys in weakness at the moment would be poor german manufacturing data and waiting on the QE from the ECB.
If you look at the DOW and DAX over 30 years the correlation is very tight, much more than the FTSE and DOW.
Both the DAX and DOW are global markets where most of there earning would come from overseas.

DOW and DAX will break down over different periods of the year.
If you can understand why in a fundamental and technical view.
It will help you in picking up the points in a variance price correction.

On Monday DAX had a dummy spit on poor German Ifo Business Climate .
Variance was out to 890 but at the US close today is now 784
After the strong Tuesday move.
 
Not sure if there is a JPY index, like the USD dollar index.
Would be a powerful tool for day trader's.

Can't you get the same information (and more) from a currency strengthmeter, like NVP's, or commercial equivalents?

In passing, I got into this kind of thing when I discovered Ashraf Laidi and his intermarket analysis. Powerful stuff, but a lot to take in. I both won and lost a lot attempting to trade using his insights (not a trading system), and now most of his stuff is on the premium part of his site, so I don't bother.

Then I discovered currency strength meters (hat tip, largely to NVP, but some others as well), and realised that while not a complete picture, they short cut a lot of the basic analysis you'd have to do bottom up from the fundamentals.

Add that to a good technical method, and I think you have at least one edge, obviously bearing in mind good risk and money management, etc.
Probably doesn't matter too much what technical method you use, so long as you are consistent, and don't place too much reliance on lagging indicators.
I have another couple of edges which I don't want to say too much about for now, not because I'm secretive, but simply because I'm not 100% sure they are truly leading or truly edges. Working on those.

As my sig says, I'm here to learn, but also happy to pass on what I learn for myself, once I'm convinced it's for real.

Currency correlation and index readilly available online.

I think this is a great site with loads of data info... (y)

I do something similar to this but on graph paper and excel with other indeces and commodities. Get a great picture :) Wall paper even :cheesy:
 

Attachments

  • FX_Correlation_Index.GIF
    FX_Correlation_Index.GIF
    80.1 KB · Views: 242
Can't you get the same information (and more) from a currency strengthmeter, like NVP's, or commercial equivalents?

In passing, I got into this kind of thing when I discovered Ashraf Laidi and his intermarket analysis. Powerful stuff, but a lot to take in. I both won and lost a lot attempting to trade using his insights (not a trading system), and now most of his stuff is on the premium part of his site, so I don't bother.

Then I discovered currency strength meters (hat tip, largely to NVP, but some others as well), and realised that while not a complete picture, they short cut a lot of the basic analysis you'd have to do bottom up from the fundamentals.

Add that to a good technical method, and I think you have at least one edge, obviously bearing in mind good risk and money management, etc.
Probably doesn't matter too much what technical method you use, so long as you are consistent, and don't place too much reliance on lagging indicators.
I have another couple of edges which I don't want to say too much about for now, not because I'm secretive, but simply because I'm not 100% sure they are truly leading or truly edges. Working on those.

As my sig says, I'm here to learn, but also happy to pass on what I learn for myself, once I'm convinced it's for real.

Thanks Mike

Don't think you can get JPY showing as a single unit against all the crosses on the strength meter.
Maybe NVP can correct me If I'm wrong.
Plus I also prefer looking at excel than a chart based form like the strength meter.
 
Update on the numbers.

DAX not looking good at the moment.

US outperforming markets around the globe.

Also Aussie dollar starting to give way.

Looking at forecast of around 82 for year end.

Could over shoot to around 78 but should be well bid below 82.

Add
Forecast is based on Aus terms of trade, UDS/JPY, iron ore/copper price and steel holding in China mills.
 

Attachments

  • Update.PNG
    Update.PNG
    182 KB · Views: 233
Last edited by a moderator:
Shorter Time Frames.

Works better in lower market volatility days.
 

Attachments

  • Short.PNG
    Short.PNG
    67.9 KB · Views: 202
Have attached a spreadsheet that I have been using for a few years.

Just looking at the DAX/DOW.
DAX was out performing the DOW at the start of the year.
But now it is 750 points under to DOW.
There would be fundamental reasons for the variance during the year.


Just thought would also show the DAX/DOW on a chart.

You can see that DOW is up 1.3% and DAX is down about 6.4% for 2014

So this will give you a total variance of 7.7% across 2014 on excel I currently have 7.9% DAX under by 757 points to DOW

Would vary slightly to the cash market

how is that dax/dow variance looking now?
 
Top