Making Money Trading

Which market do you want to learn to trade?


  • Total voters
    101
  • Poll closed .
Status
Not open for further replies.
Hi TD,
Did you manage to get back on board? It looks to have pretty well run off without offering such a chance.

Best Regards,
Neil

Unfortunately not.

A lot of markets are running away right now and I try not to chase things.

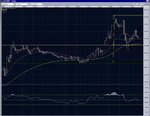
Watching Eur/Gbp is difficult right now.

I think this market has a long way to go. This is one of the strongest feelings that I have ever had with regards to market movement but as usual I will plan the optimal entry and see if the market provides me with it.
 

Attachments

  • eur.gif
    eur.gif
    22.5 KB · Views: 666
Last edited:
I've been in GBP/JPY short twice and exited for +80 and +39 on a 1200 pip move.

Lurker, I've had some success using Heiken-Ashi to keep me in a trade and prevent me from exiting too early. Have you taken a look at them at all ?
There is a great method developed by Dean Malone, called the Synergy method, using Heiken-Ashi with an unusual Channel set-up. It's very useful for providing the confidence to stay in trade.
It's not the Holy Grail by any means, but if you'd like more info, I've got a pdf presentation and various MT4 indicators you can have, just pm me.
 
Price and the scale of the chart

I believe that a market is never too high to begin buying or too low to begin selling.

However I would not buy simply because of momentum. I must always buy at what I deem to be a valid pivotal point.

I think many traders, especially the new ones, rely on their judgement of what is overbought or oversold not by knowledge of fundamentals, not by memory of where the price was in recent history, nor by use of indicators.

I think they simply look at the price in relation to the scale of the chart.

If the price is in the top right corner, it's overbought.

In a way that's somewhat logical. Until the scale of the chart adjusts, there is a temporary ceiling on the price and that makes it difficult to imagine it going higher.

I want to show you an example of why I rely on price action and nothing else to tell me where a market is likely to move.

Have a look at the chart below. I have erased all reference to the market, the price and the timeframe.

Look at the marked arrow. Would you buy here or would you consider this too high to begin buying?
 

Attachments

  • misc1.gif
    misc1.gif
    16.2 KB · Views: 1,186
Last edited:
Price and the scale of the chart *Part 2*

Maybe that was a little too easy.

Let's fast forward a little in time.

First arrow was our potential buy area above. Have a look at the pin bar in the top right hand area of this new chart.

Would you buy here after this extended run?
 

Attachments

  • misc2.gif
    misc2.gif
    13.6 KB · Views: 1,153
Last edited:
Price and the scale of the chart *Part 3*

Final chart.

Have a look at our two potential buy areas.

As you can see, both would have made excellent entry points into the trend.

The point to make is that no one knows where a market is going to go or how much further it has to run.

In this chart the market looks like it was hardly moving and yet at the time of buying it looked like a huge rally.

The only thing that has changed is the price scale of the chart.
 

Attachments

  • misc3.gif
    misc3.gif
    13.4 KB · Views: 1,075
Last edited:
Final chart.

Have a look at our two potential buy areas.

The market looks like it was hardly moving and yet at the time of buying it looked like a huge rally.

The only thing that has changed is the price scale of the chart.

Oi! 4 minutes is not enough time for us to answer! I looked at the number of bars, and the scale of the retracement, before concluding that indeed that was a buy! Point taken though - reminds me of what I was reading the other night in Schwagers Complete Guide to the Futures Market about commodity bull runs.
 
Hi to all

I have been reading this thread throughout the holiday period and I must admit this must be one of the best threads I have ever read. In fact I would personally say that it is the best thread.

There is so much good practical advise here that I don't think once someone has found this thread that they need to look elsewhere.

Certainly a lot of the points made in this thread I can relate to especially the bit about letting your losses run and taking profits early also getting even with the market and so on.

Tom

I appreciate your efforts very much I think you have given me the confidence I have been looking for all along and I do feel like 2008 will be the year that I finally keep my account from diminishing and increase it to something substantial.

Already using some of your techniques I have recovered my account which was fading away due to over trading and poor money management ,fear and haste.

I think you would do very well if you were to put all this valuable information in a book I am sure alot of people would buy it . I for one would even though you have already been very charitable by given so much for free.

Thanks again for a great thread and God bless you for this New Year.
 
Hi guys,
Just wondering.
What would people to think to posting there positions online?
No need for size or level, just so we can see what is attracting attention.
We could start a new thread so that we dont detract from this one.
Or maybe a group email? Something that is easy, so that we each have a grid and add / subtract positions accordingly.

So mine would say something like........

OMNI

LONG
- EUR/USD
- AUD/CAD

SHORT
- CAC

Obviously, we dont want to know of scalping. Trades with a few days expected horizon.
Anyone game?
PM me.
 
eur-gbp 15 min setup

Hi Folks,
This one looks promising...
Nice pin candle off EMA(60) and pivot line. See what you think.

Cheers,
Neil
 

Attachments

  • 15min eur-gbp.jpg
    15min eur-gbp.jpg
    135.9 KB · Views: 522
I think trader_dante needs his own website... with sections on everything he's talked about... in months to come, it will be hard to find the info.

Hm...
 
I think trader_dante needs his own website... with sections on everything he's talked about... in months to come, it will be hard to find the info.

Hm...

That is a great idea. However I start my new job on 15th Jan so it may be a push...

Tom
 
Trade setup

I am looking to go long on EUR/JPY.

This is not a recommendation to trade.

How will I enter this trade?

I will enter on a break of the high of the daily pin.

My stop would be one tick beneath the low of the pin.

Why I am taking this trade?

Chart 1: Daily TF shows that price has hit a significant support/resistance pivot and round number.

Chart 2 Close up of the daily TF shows a pin bar formation.

How will I manage the trade?

Chart 3 shows the significant s/r pivots that lie overhead. These may cause price to stall or reverse and as a result, if the price were to approach them I would watch it very carefully and adjust stops based on the price action that occurs.

This chart also shows a lower pivot that the price is currently sitting on. This is at 161.23. Since there is a lot of risk on this trade (199 pips) and this is a significant pivot, I aim to move my stop up quickly on this trade to the approximate area of the left eye which is beneath the pivot.

Chart 4 shows the potential fib levels that occur on the way up. Note again that price may stall or reverse at these. This is going to be tricky to judge as the zone I have drawn a square round is going to be choppy from the look of the previous price action in it. Stop adjustment will be based on price action.

The 61 level has confluence with the first major s/r pivot at 164.04. This is going to be an important area.

++++++++++++++++++++++++++++++++++++++++++
At the time of writing this, the market still has just under two hours to trade. If the price "closes" below the low of the left eye at 1.6097, then the trade for me, is invalidated.

Please note that as the market still has longer to trade, the order will NOT be placed until shortly before midnight UK time.

+++++++++++++++++++++++++++++++++++++++++

Always have a plan.
 

Attachments

  • eur-jpy.gif
    eur-jpy.gif
    17.6 KB · Views: 1,123
  • eur-jpy2.gif
    eur-jpy2.gif
    21.7 KB · Views: 1,094
  • eur-jpy3.gif
    eur-jpy3.gif
    24.7 KB · Views: 1,050
  • eur-jpy4.gif
    eur-jpy4.gif
    23 KB · Views: 1,057
I am looking to go long on EUR/JPY.

I have looked at my own charts after reading your post and will also take this signal. I have placed an order to buy 161.73 with a stop at 159.75. As this is 200 pips risk, I must only take a 1U position. Good spot! Will be interesting to see how this turns out. I'm going to keep looking for a long entry on lower TFs too.

The USD/JPY version of this trade seems much less attractive, so I will pass on it. Yesterday showed a lot of Yen weakness from around the middle of the day, so perhaps the carry trades are back on!

I've got a Sell Stop order in to go short at 159.60 to catch the downside breakout. But with a very tight safety stop in case it reverses - the Keltner/Bollinger "Squeeze*" on the Daily chart indicates a big move is coming..... one direction or another...

* for those of you familiar with John Carter's work
 
I have looked at my own charts after reading your post and will also take this signal. I have placed an order to buy 161.73 with a stop at 159.75. As this is 200 pips risk, I must only take a 1U position. Good spot! Will be interesting to see how this turns out. I'm going to keep looking for a long entry on lower TFs too.

Hi Lurker,

What were you doing up that late?! Burning the midnight oil for your degree?

Still no entry on EUR/JPY then...

I am taking 1U on it also. I will, like you, keep an eye out for hourly pa setups on this.

When the stop size is at the border of my comfort zone, as this is, I like to see if I can get a better entry into the expected move.

Sometimes the market offers it, sometimes it doesn't.

If you get a good one, you can usually not only cut your risk but up your size into the move.
 
I've got a Sell Stop order in to go short at 159.60 to catch the downside breakout. But with a very tight safety stop in case it reverses - the Keltner/Bollinger "Squeeze*" on the Daily chart indicates a big move is coming..... one direction or another...

* for those of you familiar with John Carter's work

Hey rathcoole! How's tricks?

I'm not familiar with Carters work BUT I know that some people play failed pin bars which would more or less coincide with your short entry.

Good luck if it triggers.

And happy New Year!
 
I've got a Sell Stop order in to go short at 159.60 to catch the downside breakout. But with a very tight safety stop in case it reverses - the Keltner/Bollinger "Squeeze*" on the Daily chart indicates a big move is coming..... one direction or another...

* for those of you familiar with John Carter's work

Well, we are a long way from the August lows and this is the only pair (aside from NZD which is a different kettle of fish) which hasn't gone back down through them. I'm not taking the short side of this unless I get a setup, but it is something to keep in mind.
 
What were you doing up that late?!
Woke up a little early, so checked markets and T2W before going back to bed.

Still no entry on EUR/JPY then...

Or anything else for that matter.
I am taking 1U on it also. I will, like you, keep an eye out for hourly pa setups on this.

When the stop size is at the border of my comfort zone, as this is, I like to see if I can get a better entry into the expected move.

Sometimes the market offers it, sometimes it doesn't.

If you get a good one, you can usually not only cut your risk but up your size into the move.

Border of my comfort zone too. I couldn't have afforded this trade last week. I'm not too sure about further yen weakness or euro strength at this stage, but I'm open to what the chart tells me. Indeed a break north from the PDH would be bullish, but I don't know how much this move has in it. I'd like at least 150 pips given the risk.
 
Status
Not open for further replies.
Top