You are using an out of date browser. It may not display this or other websites correctly.
You should upgrade or use an alternative browser.
You should upgrade or use an alternative browser.
Making Money Trading
- Thread starter trader_dante
- Start date
- Watchers 334
- Status
- Not open for further replies.
tafita
Guest
- Messages
- 191
- Likes
- 23
FWIW, I would like to see a better looking pin. That is, the pin "head" to be formed within the bottom third of the bar preceding it. I am a newbie at this method so please take with a pinch of salt. TD can elaborate further. All other factors look good to me though.
Tafita
Tafita
lurkerlurker
Senior member
- Messages
- 2,482
- Likes
- 150
Entered USDCAD short from 0.9962 from hourly pin off long term S/R zone. Stoploss up at 0.9990 - risk 30 pips or so. First target 0.9920.
Out flat.
lurkerlurker
Senior member
- Messages
- 2,482
- Likes
- 150
FWIW, I would like to see a better looking pin. That is, the pin "head" to be formed within the bottom third of the bar preceding it. I am a newbie at this method so please take with a pinch of salt. TD can elaborate further. All other factors look good to me though.
Tafita
Good point.. thought the pin wasn't great looking but also that my reasons for going long were good enough to not be too bothered about that. Maybe they weren't. We'll see how it goes, although that might not shed enough light on whether I was right or wrong to go in. 🙄
When I draw my fibs I think it makes sense to just get the last up leg when looking for a retracement. Did you get that bigger fib from the same time frame FXBee? I would draw fibs on last up leg on hourly, then on daily. I don't think I'd just draw them from 2nd last low to recent peak, then 3rd last low to recent peak, then 4th.. etc to find confluence.
I think I've seen TD do this on a chart so it's probably ok. Just think it makes more sense with only the last one. If you'd do it on 4H as well I guess you'd get one more. Would anyone with more experience with fibs agree with this thinking?
I think I've seen TD do this on a chart so it's probably ok. Just think it makes more sense with only the last one. If you'd do it on 4H as well I guess you'd get one more. Would anyone with more experience with fibs agree with this thinking?
trader_dante
Veteren member
- Messages
- 4,535
- Likes
- 1,704
http://uk.youtube.com/watch?v=77Xytfw4N2o
Hey TD
Have a look at this on youtube. They are taking reversal`s when fibs are failing at retracements. They seem to be drawing it in reverse however.
For the cable trade, he draws the 1st fib in the direction of the uptrend from swing low to high. Fair enough. Then, for the next day, he draws it from the intraday (15min) low to high - and says its pointing down. Price fails at 61.8% and goes down.
These guys are using the extensions as profit targets which I know you dont do.
If in an uptrend,can retracements be used as resistance ?
Thanks
CT.
Hello CT,
I watched that section of the video several times over and I am sure he is reading the fibs wrong.
He draws the fibs from the LOW to the HIGH but then says the 61 is nearest to the high which is impossible.
If you fib from a low to a high to measure a retracement of a swing upwards, then the 38 would be nearest to the top.
At any rate, I was hesitant to say a "professional" is doing things wrong so I asked others with more experience to verify it for me.
While the question has not been directly answered as of yet, I agree with the unanimous opinion that he makes a big MISTAKE in drawing fibs on such a small range in the first place.
The fibs are, at seven pips apart, way too close and completely lose their meaning.
What does this mean?
Be careful who you take trading advice from 🙂
Last edited:
trader_dante
Veteren member
- Messages
- 4,535
- Likes
- 1,704
If in an uptrend,can retracements be used as resistance ?
CT,
I wanted to answer this question in a seperate post. I would say no.
In an uptrend, I would use retracements to measure areas where price will find SUPPORT.
Nordtrader
Member
- Messages
- 62
- Likes
- 11
Nice pin on USDCAD. I would have taken this but for IG's trading hours. Apologies for asking the question here but does anyone know how I can get to trade currencies at this hour?
You could try CMCMarkets.com if you aren't averse to the spreadbetting option.
tafita
Guest
- Messages
- 191
- Likes
- 23
You could try CMCMarkets.com if you aren't averse to the spreadbetting option.
Thanks NT. I've just called IG's helpdesk to be told their FX markets are 24 hours🙄 Any comments re: my last post can be emailed to [email protected]😆
Tafita
trader_dante
Veteren member
- Messages
- 4,535
- Likes
- 1,704
Here's a trade that I'm in right now (on paper), it's in the red just now.
Should I have moved this to BE just after the quick move up? On the close of bars there wasn't any time to do that however. It is heading back up to my entry
once again, I'm not sure if one should always expect strong momentum in the right direction after the pin, and if none is there, get out?
You will not always get strong momentum straight after a pin triggers.
In addition, the price will often take off and then RETRACE to your entry point. Many, many times I move my stop to breakeven when the trade is in profit and then see price come back and take me out, before continuing on in the direction I had anticipated.
To overcome this I now try and hold the stop in its original place until price has based above my entry.
In light of this I would say that the only reason to move a stop to breakeven quickly is if there is a STRONG s/r pivot in the path of the price and it is having difficulty breaking it.
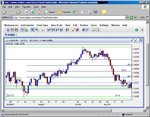
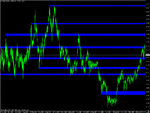
It has also passed the fibs by a fair amount. Would that cause any of your alarm bells to ring, or is it ok as long as there are other confluences?
It has passed the fibs from the most recent swing low. However, if you draw them from the previous swing low you will see price has found support close to the 61.8.
See chart 1
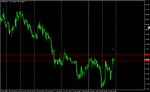
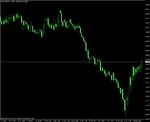
Is my weekly pivot lines drawn in where you would have TD?
Here is my chart for comparison.
See chart 2
I haven't gone quite as far back as you.
Attachments
trader_dante
Veteren member
- Messages
- 4,535
- Likes
- 1,704
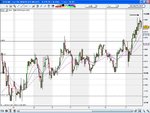
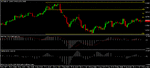
Hi ER2
Everyone can see the S/R differently. I am also attaching my view to this with pivots drawn to it, TD, can correct on both that charts if anything is missing. There is a good Fib confluence in my view.
Fxbee
Hi Fxbee,
See my response to ER2 above 🙂
trader_dante
Veteren member
- Messages
- 4,535
- Likes
- 1,704
Good point.. thought the pin wasn't great looking but also that my reasons for going long were good enough to not be too bothered about that. Maybe they weren't. We'll see how it goes, although that might not shed enough light on whether I was right or wrong to go in. 🙄
Tafita and ER2 - you're both right really.
I agree with Tafita that a "perfect" pin would have its head in the bottom third of the bar preceeding it.
I would certainly want to see this if I was to take a pin at a swing high or low with no confluence.
However, this is an acceptable looking pin if you have additional strong factors that support the trade idea.
trader_dante
Veteren member
- Messages
- 4,535
- Likes
- 1,704
When I draw my fibs I think it makes sense to just get the last up leg when looking for a retracement. Did you get that bigger fib from the same time frame FXBee? I would draw fibs on last up leg on hourly, then on daily. I don't think I'd just draw them from 2nd last low to recent peak, then 3rd last low to recent peak, then 4th.. etc to find confluence.
I think I've seen TD do this on a chart so it's probably ok. Just think it makes more sense with only the last one. If you'd do it on 4H as well I guess you'd get one more. Would anyone with more experience with fibs agree with this thinking?
Hi ER2,
I was taught to find confluence by drawing fibs from multiple swing lows in an uptrend and from swing highs in a downtrend.
You should do what works for you though.
trader_dante
Veteren member
- Messages
- 4,535
- Likes
- 1,704
Thanks NT. I've just called IG's helpdesk to be told their FX markets are 24 hours🙄 Any comments re: my last post can be emailed to [email protected]😆
Tafita
Hi Tafita,
I'm not sure about that pin.
The only thing it has in its favour is that it shows a rejection of the KEY 1.0000 level (or parity).
On the daily TF we have a clearly defined V bottom with a break higher from recent consolidation which is very bullish.
In addition, when we have a pin with no real confluence like this, we want to see the body within the top third of the preceeding bar.
You just wrote that yourself a few posts back 🙂
Attachments
lurkerlurker
Senior member
- Messages
- 2,482
- Likes
- 150
Failed pin, losing trade
This pin failed, giving a loss of 37 pips. After I have enough of these trades, I'll know what my average win and loss is, but right now it appears average loss is quite larger. At least I didn't move the stop, although the next level of resistance held. I didn't average down either, so the trade was managed well. Sometimes a signal won't work out - time to move on.
Down -30 on the week so far.
Had a limit in to sell 108.57 but ended up selling 108.55 instead, so I've got an entry slightly below the break of the pin. First target around 108.30, but it could go lower so this is a tricky one. Anyway, short 55 with stop of 90.
This pin failed, giving a loss of 37 pips. After I have enough of these trades, I'll know what my average win and loss is, but right now it appears average loss is quite larger. At least I didn't move the stop, although the next level of resistance held. I didn't average down either, so the trade was managed well. Sometimes a signal won't work out - time to move on.
Down -30 on the week so far.
lurkerlurker
Senior member
- Messages
- 2,482
- Likes
- 150
Nice pin on USDCAD. I would have taken this but for IG's trading hours. Apologies for asking the question here but does anyone know how I can get to trade currencies at this hour?
I deliberately didn't take that trade as the pin bar a few hours before failed.
combotrader
Active member
- Messages
- 187
- Likes
- 10
Hey CT
My thoughts precisely - that he was reading the fibs wrong. But in the link you sent me as well - some of these traders seem to be using fibs as resistance in uptrends. I dont quite get it.
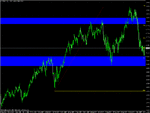
Have a look at the 4 hr chart I`m sending you of cable. I always check the 4hr afer the daily and before the 1hr - which is my trigger chart. If it lines up in 3 TF then its a go..have a look at the 50% - it acts as resistance.
Fibs are new to me - stuff on the net seems patchy. Might have to buy a book.
Yrs
CT
PS - also note how the 61.8 is acting as support...
My thoughts precisely - that he was reading the fibs wrong. But in the link you sent me as well - some of these traders seem to be using fibs as resistance in uptrends. I dont quite get it.
Have a look at the 4 hr chart I`m sending you of cable. I always check the 4hr afer the daily and before the 1hr - which is my trigger chart. If it lines up in 3 TF then its a go..have a look at the 50% - it acts as resistance.
Fibs are new to me - stuff on the net seems patchy. Might have to buy a book.
Yrs
CT
PS - also note how the 61.8 is acting as support...
Attachments
lurkerlurker
Senior member
- Messages
- 2,482
- Likes
- 150
Not fond of correlated positions, but I've sold GBPUSD at 2.0683 (stop at 2.0718) and bought EURGBP at 0.7170 (stop 0.7162). Both trades are taken on the basis of hourly pins. GBPJPY is also heading into resistance.
- Status
- Not open for further replies.
Similar threads
- Replies
- 3
- Views
- 2K