Making Money Trading

Which market do you want to learn to trade?


  • Total voters
    101
  • Poll closed .
Status
Not open for further replies.
SMB,

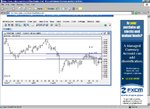
Look at the last three candles on your chart.

The first one is a doji - it represents indecision and not a firm rejection of a bottom.

The second one is also a doji but this time it has a range expansion. This means the bulls and bears are playing a little more actively now.

The third (at least on my chart) is a pin bar. It is a pin bar at a double bottom (zoom out and look left).

However, the pin's nose doesn't poke far enough out from the other bars on my chart (and is a tweezer bottom on yours) This is something that I like to see and as such I would most likely not have taken this setup.

If I had, I would be quick to get my stop to BE on this as 1.1650 (which it is now testing) is first area of difficulty in my opinion.

I will take a reversal against the trend if I feel there is a strong reason to do so. I take many of the factors already outlined in earlier posts into consideration when I do. Trading against the trend can be very profitable but it can also result in the downfall of a trader. And it is important to remember that it is a very different game to trading with the trend and as such it has different rules.

More on this will develop over time.

It's difficult for me to post chats whilst at work but when I get home I am going to show you all an absolute stunner of an entry on AUD/CAD 1hr.

Thanks for your prompt reply TD, I look forward to engaging in live debate with yourself.
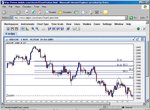
As we speak my first scale-out target has been hit just above the round number 1653. A case of trailing the rest for today's daily p/l target. 1670 is potential s/r zone on my charts.

Thanks

SMB
 
Last edited:
Quick note to all: I have a dreadful habit of editing all my posts as long as it will let me do so. This is because I frequently re-read what I have written and think of better ways to say things or important things to add.

Sometimes I just like to play with the spacing - I am convinced the way words/sentences appear is crucial to how we understand them and the impact they have.

Everyone would be advised that if they have asked me a direct question, to have a quick re-read of my answer an hour or so after it appears - I just added to your reply SMB.

Thanks,
Tom
 
Hi FXbee,

No, this is NOT a pin bar. A pin bar will have the following characteristics.

- A long "nose"
- A small "body"
- The body will be in the lower/upper 1/3 of the candle or bar

Look carefully at that chart with my examples and you will see these characteristics.

You will see MANY more examples of these bars as we go on.

Hi TD,

Do you wait to form the full eyes (bars on both side of pinbar) and trade on break of high/low of pinbar (Bcoz i think only on seeing full formation we can realise its a perfect pinbar)?

Also in drawing your fibs, (in uptrend we draw from bottom to top), i believe you dont mind in using the previous / after bar to the swing low/swing high to match the confluence? [I hope we get this habit once when we are used to on looking at the charts]


Fxbee
 
Do you wait to form the full eyes (bars on both side of pinbar) and trade on break of high/low of pinbar (Bcoz i think only on seeing full formation we can realise its a perfect pinbar)?

Hello again forexbee. No, I don't wait for the right eye to form fully.

The left eye is the important one for me. I like to see the open/close of the pin bar itself, within the range of the left eye. Whether it HAS to be I am unsure. This is just what I look for. Once I see this I play a break of the high/low of the pin bar. This means I enter on the right eye if it triggers my order.


Also in drawing your fibs, (in uptrend we draw from bottom to top), i believe you dont mind in using the previous / after bar to the swing low/swing high to match the confluence? [I hope we get this habit once when we are used to on looking at the charts]

When I draw fibs I use the EXACT bar of the swing high/low.

I never TRY to create confluence.

If it exists I act. If it does not exist, I move on.

Draw your fib levels and S/R levels on the chart and wait for the market. I cannot emphasise this enough.

If you do not there is the possibility that you may be "fitting" areas to your pin (sometimes subconsciously) as in you find yourself saying: "right let's draw a fib down from this high...hmm no it doesn't line up very well....now lets try this high....hmmm no that doesn't work either, price is between the 38 and the 50 in no mans land....now let's try this high area...ok fair enough it's not really the high its more like a high within consolidation but hey it lines up wonderfully with the 61....yes this looks good".

I found myself doing this with S/R in the early days of learning price action (really only this time last year) Of course I didn't do it intentionally but it's hard to prevent your eye from being drawn to the nose of the pin and then looking left and seeing a line or a zone where there perhaps isn't one...

Never look for a reason to trade.
 
Hello again forexbee. No, I don't wait for the right eye to form fully.

The left eye is the important one for me. I like to see the open/close of the pin bar itself, within the range of the left eye. Whether it HAS to be I am unsure. This is just what I look for. Once I see this I play a break of the high/low of the pin bar. This means I enter on the right eye if it triggers my order.

When I draw fibs I use the EXACT bar of the swing high/low.

I never TRY to create confluence.

If it exists I act. If it does not exist, I move on.

Draw your fib levels and S/R levels on the chart and wait for the market. I cannot emphasise this enough.


Never look for a reason to trade.

Hi TD,

Great, very quick reply. thanks :)

i have tried using the indicator for pinbar thru FF forum. But i prefer to point it myself rather using a indicator as it gives good experience to feel the market... Sometimes i see the pinbar identified by the indicator doesnt brings profitable trade...Is it worth to use it and learn finding the pinbar? Your views & opinion on this is highly appreciated for newbies

Cheers
Fxbee
 
It's annoying that it is so difficult for me to post charts whilst at work or I would try and post examples rather than so much writing. In the evenings and at weekends I will make up for it with a lot of charts.

I want to ask you all to do something. You will find this fascinating.

Pull up a chart of AUD/CAD.

If you don't have this pair or don't have the time/inclination to do this then I will simply post the chart tonight but if you do this YOURSELF you will really get a feel for this.

1. Open the chart and go to the daily TF.
2. Draw a fib from the 5th April high to the 17th August low.
3. Draw another fib from the 26th July high to the 17th August low.
4. The key levels of the 50 and the 61 from these two swing highs should be almost pip for pip on top of one another. But we're not finished yet.
5. Draw in a resistance line at 0.8880. Follow it left. This should be RESISTANCE briefly in May, SUPPORT throughout June and then RESISTANCE throughout the end of September and early October.
6. Have a look at the daily bar so far today :)
7. Now go onto the hourly timeframe. What do you see at 9am?

This is how I operate in the market. These levels are already on my charts. I didn't trade this hourly setup.

It is not a picture perfect pin but it is a pin nonetheless and it is at a key area. This trade could make good money. It could make no money. It could even turn into a loss if badly managed BUT this is how I work.

BE PREPARED. WAIT. ACT.
 
Last edited:
Hi TD,

Great, very quick reply. thanks :)

i have tried using the indicator for pinbar thru FF forum. But i prefer to point it myself rather using a indicator as it gives good experience to feel the market... Sometimes i see the pinbar identified by the indicator doesnt brings profitable trade...Is it worth to use it and learn finding the pinbar? Your views & opinion on this is highly appreciated for newbies

Cheers
Fxbee

This is somewhat of a personal preference.

I can't comment on the pin bar indicator myself as I have never used it and never would use it.

There IS an advantage in having an indicator do the work for you - it CAN alert you to good setups you might have otherwise missed. Once you are alerted to it you can then make a discretionary decision. In this respect it makes sense.

Nonetheless I personally prefer to look for setups myself.
 
I am not sure what you mean by "true" S/R. I regularly see TL's with multiple touches (a third touch is minimum necessary for confirmation) that result in significant profit each time.
t_d,
I suspect firewalker99 was referencing comments made by dbphoenix - probably somewhere in this thread:
http://www.trade2win.com/boards/showthread.php?t=11104
If dbp is reading your thread, my guess is that he's refraining from posting until you've had sufficient time to advance your ideas and to help ensure that the thread doesn't get derailed - something he has had to contend with a fair bit himself over the years.
Well done with your effort so far t_d. Also, good move to start setting out your stall before the poll closes!
;)
Tim.
 
Hi TD,

Just checked up the chart, wow, thats really nice to see how you take your setup...

Also i understand from the chart as why you dont say its not a perfect pinbar, i think its nose doesnt peek up well....Right?

Cheers
Fxbee
 

Attachments

  • pinbar2.JPG
    pinbar2.JPG
    134 KB · Views: 3,214
t_d,I suspect firewalker99 was referencing comments made by dbphoenix - probably somewhere in this thread:
http://www.trade2win.com/boards/showthread.php?t=11104

I KNEW that I was going to learn many things myself when I started this thread which is another reason I did it. After reading only the first couple of db's posts, I know he is going to push me further along the path to mastering this business. Thank you.
 
Last edited:
This is somewhat of a personal preference.

I can't comment on the pin bar indicator myself as I have never used it and never would use it.

There IS an advantage in having an indicator do the work for you - it CAN alert you to good setups you might have otherwise missed. Once you are alerted to it you can then make a discretionary decision. In this respect it makes sense.

Nonetheless I personally prefer to look for setups myself.

FxBee & TD,

It's very easy to code up an indicator in binary form to give you a signal when a *psychologically important candle has formed.

*pinbars, gravestones, hammers etc
 
Hi TD,

Just checked up the chart, wow, thats really nice to see how you take your setup...

Also i understand from the chart as why you dont say its not a perfect pinbar, i think its nose doesnt peek up well....Right?

Cheers
Fxbee

The hourly pin has a slightly larger body than I would like and does not poke far enough above the other bars for my liking.

The daily pin as it stands when I wrote that post (and bear in mind it is not anywhere near closed yet) is a perfect short setup and if it remains that way I will call it live.

Hi TD,

I understand clearly what you mean, that bar clearly shows me how to read the pinbar...( i checked that in 4hrs chart, it does look similar to your comment [pin has larger body])
By the way, the trend on longterm looks like its in uptrend, though the setup on pinbar we see on short entry, can we say it as intermediate cycle?

Fxbee

I don't have enough history on my chart here at work. I will answer this when I get home.

EDIT: OK, I am home now.

Fxbee - A phrase like "long term" is largely subjective.

But in my opinion, the long term trend looks DOWN.

My historical data only goes far back as November 2003 though.

The intermediate trend (last six months) is also DOWN.

The short term trend (last three months) is UP.

So we are trading AGAINST the shorter term trend and WITH the intermediate and long term trend if we were to take this short.
 

Attachments

  • aud.gif
    aud.gif
    21.7 KB · Views: 2,796
Last edited:
I like to drop little breadcrumbs from time to time. You can pick them up and see if they lead you anywhere.

This morning I was on the bus to work and I read this line in my book:

"If you're going to trade with the trend then the most important step is to find the trend. It's not sufficient to simply intuit that the trend is up or down."

How the Futures Markets Work - Jake Bernstein

I have had it in my mind all day.

What does it mean to you? Have a think about it.
 
Hi TD

Just checked thru USDCHF, market fib's and pivot lines as you have been teaching...
Is it ok for you to comment on this chart for marking the Pivot lines & Fibs + Pinbar circled...? To make sure iam not missing anything... or can correct myself which could help other fellow newbies....
[Personally i think the body needs to be bit more smaller for the pinbar, though not sure]
Cheers
Fxbee
 

Attachments

  • pinbar3.JPG
    pinbar3.JPG
    100.7 KB · Views: 2,309
I have studied economics for two years since we are dealing with price action I wanted to fully define price how economists view it.
 
Market Call- Aud/cad

I am looking to go long on AUD/CAD.

This is not a recommendation to trade.

How I will enter this trade

I will enter on a break of the high of this hourly pin. I normally enter trades one tick above the high.

Stop would be one tick beneath the pin.

Why I took this trade

From left to right:

Chart 1: Daily TF shows that price is coming into a significant support/resistance pivot.
Chart 2: Hourly TF shows that price has formed a pin bar at this level. Look to the left arrow. It made almost the same setup earlier and triggered a very profitable run upwards.

Where I would look for potential problem areas

Chart 3: Daily TF shows another significant S/R pivot at 0.8894 and confluence with the 50 fib level from the swing high.

Chart 4: Daily TF shows the 61 fib level from the next major swing high matches up with the 50 and the S/R pivot. These levels are literally all on top of one another which makes the individual elements hard to see. This is why price was extremely likely to have trouble breaking through this area earlier.

Chart 5: This is the final picture I am looking at. The hourly chart. It looks a mess to the unitiated. But if you have followed my thinking through it should start to make sense to you. What you can see is that the levels I have drawn on the daily TF have filtered through to my hourly TF. Now I have them in place, what I have done is examined the hourly itself and drawn on two areas that were previous S/R flips in todays session. They are MINOR levels but they are worth noting. They are indicated with arrows.

How I would manage the trade

Based on my levels:

If market hits 0.8800 I will move stop to BE.

If market hits 0.8830 I would move stop to 0.8795

Main target is 0.8890. I will look at the price action at this level (if it was to reach it) BEFORE blindly closing.

Always have a plan.
 

Attachments

  • aud1.gif
    aud1.gif
    19 KB · Views: 4,474
  • aud2.gif
    aud2.gif
    17.9 KB · Views: 4,312
  • aud3.gif
    aud3.gif
    22.8 KB · Views: 4,081
  • aud4.gif
    aud4.gif
    23.4 KB · Views: 3,579
  • aud5.gif
    aud5.gif
    17.5 KB · Views: 3,813
Last edited:
If anyone is in any doubt as to the power of support/resistance and how it can increase your odds of making a profitable market call I want to show you something.

Have a look at this post I made yesterday http://www.trade2win.com/boards/showpost.php?p=366534&postcount=132

Pull up that chart from yesterday and look at the top resistance line that I have drawn on my chart AT 0.8894. This is the area I expected the market to stall. As you can see from the chart, when I posted this, the market was trading a good 60 pips below this area but heading up into it.

The chart attached in this post is what happened to the market after (on the hourly timeframe).

As you will see, I managed to call that resistance area to within one pip.

At my pre-drawn level, price action showed me a pin bar and indicated that there could be a move down.

This is how I get a huge deal of confidence when I place a trade.
 

Attachments

  • aud.gif
    aud.gif
    18.1 KB · Views: 3,621
Last edited:
And a Profit!

I made it out of that trade with +3 pips :cheesy:

(I'm sure I would have had much more, but I've been learning how to use IG's platform today for the first time, and I didn't tell this trade to roll over, so it expired market on close). Still, a profit!
 
Last edited:
Status
Not open for further replies.
Top