Making Money Trading

Which market do you want to learn to trade?


  • Total voters
    101
  • Poll closed .
Status
Not open for further replies.
That euro trade looks like it is doing the business rather effectively, well done to all who are in! I didnt myself as I was already in a trade short cable.

Was the last trade in March bringing my 2 month old 'pin account' to +15% ... now if I could find a way to live on 89p a day, I could be a pro !!! Serioulsy though 15% for me is excellent and I must thank you TD very much for your teaching.

I think I still need to sort my greediness out in trading, and probably trade less as well.

Thanks 1Pipped.

I am really interested to see how people are doing with this technique.

Glad you are having success with it.
 
Hi All

TD I was in the EUR trade too and your methods are starting to work for me too.
I actually got out within in 2 ticks of it retracing of a Fib level so it was good to see how that worked out.

A bearish pin has formed on GBP/JPY after a strong rise today. The nose has touched on previous resistance at the 20170 level but this is not a recent S/R pivot. Would be interested to hear what others say about this one. ( I think TD may say it is not a great setup, although the Pin has formed after a strong rise up so i expect it to retrace somewhat )
 
Last edited:
Hi All

TD I was in the EUR trade too and your methods are starting to work for me too.
I actually got out within in 2 ticks of it retracing of a Fib level so it was good to see how that worked out.

A bullish pin has formed on GBP/JPY after a strong rise today. The nose has touched on previous resistance at the 20170 level but this is not a recent S/R pivot. Would be interested to hear what others say about this one. ( I think TD may say it is not a great setup, although the Pin has formed after a strong rise up so i expect it to retrace somewhat )

This is the 1hr chart zoomed out.

As you can see the pin has hit a solid resistance (magenta coloured line) for the third time. The more a resistance (or support for that matter) gets hit, the more nervous I get.

Levels can get eroded the more they are touched.

To add to the bullish case, the market has broken out of a descending TL (red line).

The previous support in this downwards trending market (and the potential PIVOT) is over 100 pips higher (yellow line) and the market might target this. This is the area that I would look to go short - not right now.

Be aware that if you do go short at this yellow line, the magenta line is going to become a PROBLEM AREA as that may then, in turn, become a support.
 

Attachments

  • gbp-jpy.gif
    gbp-jpy.gif
    18.3 KB · Views: 739
TD thanks for the prompt reply. I will keep and eye on it to see what develops and be ready if a Pin forms higher up.
 
What do you guys think of the pin on the nzd/usd? Sure is tempting, but Im not sure if I would say there is enough confluence.

Edit: on the daily chart.
 
Hi TD,

Thanks for your advice on the eur/usd trade.

When you say that you move your stop into the last area of consolidation, would that be on the daily time frame; as I opened the position off of the daily?

I know that throughout the thread you advised to enter and exit on the same time frame. Do you then stick to PA on the dailies to signal an exit on this one?

Thank you ;)

Hi rider5,

Yes, I would stick to the same TF you entered on. From time to time I do break this rule AND ALMOST EVERYTIME I DO, I REGRET IT.

I'll give you the best example of how breaking the rules can be painful. Early on in this thread I called a long in Eur/Gbp off the monthly TF. You might remember seeing it. I called it because of the breakout of the ascending triangle which then resulted in an inside bar indicating consolidation before a possible move higher (see red arrow on chart).

I tried to be clever and went down to the daily TF to manage this and eventually exited it for +101 ticks.

As you can see from the monthly TF, it is up almost 900 ticks and if you only watched that TF there is no doubt you would still be in this as there has been no sign of it stalling.

9 X the profit THROWN AWAY by breaking the rules.
 

Attachments

  • eur.gif
    eur.gif
    16.3 KB · Views: 687
Hi HeiPaaDeg, here is my nzd/usd daily chart (+ an hourly too). Its a bit scruffy where I have drawn that top pivot - I suppose you could put it anywhere around there, but the pin is right underneath where I have marked mine.

On the 1hr or 4hr chart you could look for inside bars forming under the pivot. Or wait and see if it can get over, and test the pivot from the top side before getting in, as it looks a bit close to me. Thats what I am going to be waiting for anyway ... but it does look a nice pin.
 

Attachments

  • nzdusdd1.gif
    nzdusdd1.gif
    22 KB · Views: 381
  • nzdusdh1.gif
    nzdusdh1.gif
    13.5 KB · Views: 315
Hi TD,

Thanks for your speedy reply.

I had a look at that inside bar on eur/gbp and with a stop just underneath it, it would now have been 900 pips reward for 126 pips risk. That's pretty impressive!

The key would probably then be not to look at ones position until the close of the bar on that particular TF. It's silly but I'm always afraid that when price reaches that first potential problem area, it's gonna reverse in a single bar and take me out. :eek:

Anyway, the new day on my feed has just begun and I'm 143 pips in profit, which is exactly the size of my stop/risk.

Thank you Sir Dante :)
 
EUR/USD TRADE
Where do people have there stops?

Mine is at 15701... i am working off the daily TF.
 
Hi omni,

I'm sorry I can't help you as far as stops go. Before I took the trade I decided to let PA lead me on this one, so I don't have a fixed TP in mind.

I just looked at the 4H chart and it's making me nervous, but there's still 9 hours to go before the close of the 2nd bar of this trade. So it's wait and see (and hope).

I do know that I'm not gonna move my SL right now, I've been kicked out and left to watch the bus leave without me, too many times. If this pin was not the start of a big move and I do loose, it was what I was prepared to loose in the first place.

Good luck ;)
 
This is the 1hr chart zoomed out.

As you can see the pin has hit a solid resistance (magenta coloured line) for the third time. The more a resistance (or support for that matter) gets hit, the more nervous I get.

Levels can get eroded the more they are touched.

To add to the bullish case, the market has broken out of a descending TL (red line).

The previous support in this downwards trending market (and the potential PIVOT) is over 100 pips higher (yellow line) and the market might target this. This is the area that I would look to go short - not right now.

Be aware that if you do go short at this yellow line, the magenta line is going to become a PROBLEM AREA as that may then, in turn, become a support.


TD I'm watching GBP/JPY again. and looks like another Pin forming at the moment. Price has risen quite a bit more than you indicated on the chart yesterday where you said you would look to short. Do you think this has gone too high through the S/R to short?
 
TD I'm watching GBP/JPY again. and looks like another Pin forming at the moment. Price has risen quite a bit more than you indicated on the chart yesterday where you said you would look to short. Do you think this has gone too high through the S/R to short?

Hi Ljr,

It's not a good pin on my MetaTrader feed. The body is too large compared to the nose and it appears in the midst of consolidation. Best left alone in my opinion.
 
not sure this is the right thread to post this on, apologies if I got it wrong.

Anyway, this is a trade I'm in at the mo, I'm long cable.

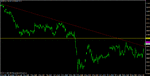
from the attached chart (2yr daily), we see a culmination of two fib levels; support from the 365 ema, and what *may* be an upward channel forming.

*I took an entry from the hourly, and got in @ 1.9833 with a stop @ 1.9730 ish. However i'll be using the daily to monitor it, which is why I've attached the daily and not the hourly chart*

reasons for posting are as follows:

*not been live since last yr, so I've put my balls on the line instead by making this call - just to keep it interesting. (I have tried putting my balls where my mouth is instead of my money, but couldn't reach ;) . although I have blown myself up before! ).

*be interesting to hear other views

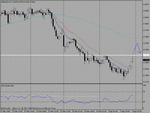
Additionally, I wanted to make highlight the candles in this setup; Dante has (convincingly, and with style) shown that pin bars can be very effective triggers for a trade; In this case, the current candle and the prior candle, IMO, are also a pretty good trigger - yet they are NOT pin bars, or a Double Low (tweezer) w/ higher close pattern, or a textbook bullish piercing pattern, or bullish engulfing or any of the (major) recognised candle patterns. I guess you could call todays bar as a Bearish Belt Hold pattern, but thats it. Perhaps one could argue that the two bars, combined, would form a pin bar, but i think it would be a weak one.

What I am trying to say is that (IMHO) "textbook" PA setups should not be considered as exhaustive - these last two bars look pretty inconspicous (sp?), and may have fallen under the radar for some - but from "reading" the price as it goes along I think they have generated a pretty strong trade opportunity.

So anyway I'm long; moved my initial stop just above BE, and going to watch this baby develop. Looking to take 1/2 profits @ the 2 / 2.01 region (ideally above the two 38.2 fib levels); then move other 1/2 stop to below the 2.00 mark and let the rest run. Not trying to ruffle any feathers or hijack the thread for 5 mins of fame; just trying to highlight something that may not have been picked by others.

sorry for the crappy quality pic; couldn't figure out how to get it clearer.
 

Attachments

  • 2008-04-02-TOS_CHARTS.jpg
    2008-04-02-TOS_CHARTS.jpg
    185.3 KB · Views: 491
What I am trying to say is that (IMHO) "textbook" PA setups should not be considered as exhaustive - these last two bars look pretty inconspicous (sp?), and may have fallen under the radar for some - but from "reading" the price as it goes along I think they have generated a pretty strong trade opportunity.

Hello MrGecko - Thank you for posting, I enjoyed your analysis.

That's what good trading is about in my opinion - identifying the important levels (whether they be s/r pivots, fib levels etc) and then reading the price action as the market trades into them.

Pin bars (hammers in candlestick terminology) are no new insight. Their reliability has been noted for years. I had heard of them (and traded them) many years ago when I had no real idea what I was doing. But what it took me so long to realise is it's the WHERE that matters and not the WHAT.

That is to say, don't look at the candle first but rather where that candle appears.

You will find that once you get good at finding these PIVOT AREAS you can start drilling down into what the price is telling you. Is price: trading into it and then decisively rejecting it (hammer/pin bar), is it trading into it and then finding a temporary base before lifting firmly off it (double bar low, higher close) is it consolidating (inside bars), is it moving into it or through it with momentum (bullish or bearish bars).

And then as MrGecko shows, you can start getting creative. :)

Tom
 
Status
Not open for further replies.
Top