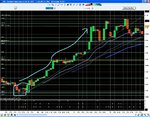
Hi trader_dante - I am new to this and I am wondering if perhaps you had seen this chart just now, or perhaps whenever that third pin (or closely resembling a pin) formed... would you have entered in on the trade? Or has the tail fallen too low below the s/r line?
Thanks for all you are doing.
EDIT: Tennis is referring to the pin bar that was forming as I posted this chart above:
http://www.trade2win.com/boards/attachment.php?attachmentid=30462&d=1193770559
Tennis - this is a great question. I was sitting here just now staring at this setup and wondering why I
didn't want to go long.
Ultimately as a trader you have to decide whether you are going to commit some money to a trading idea.
I see you are in California so you probably won't have heard of this but over here in the UK we have a programme on Television called Dragons Den.
In this program, a group of rich entrepreneurs sit in a room and people come in with products they have designed and made to show the group and try and convince them to invest in their idea. Perhaps they need capital backing so they can go into production or perhaps it is for marketing costs. Anyway, the point is, the entrepreneurs sit there and they listen to the person, look at the product, ask some questions and consider whether they want to invest in the person and their idea.
Sometimes they think the product has great potential and will make them a worthwhile profit for the risk taken in investing in it. If so, they negotiate a deal to provide the money for a percentage stake in the business.
You can see though, that from time to time, although everything looks good on "paper", some of them get a negative feeling from the person. It could be because they feel they are being told a lie or it could be the way they come across in their behaviour. Maybe you can see where I am going with this...
Would I invest in this chart based on this setup? The answer is no.
Do I have a clear answer I can express to you as to why? The answer is also no.
The closest I can come to a reason is that the pin nose is not poking out far enough from the other bars and there is also not enough space between it and the other bars. I think the body extends too far up into the previous bar. Something just doesn't feel right about it. That doesn't mean it won't work it's just that there are so many trade setups out there that there is no harm in moving on and waiting for the next one.