asarda007 said:
Hi DeskPro,
If you do trade using Wave59 kindly let me know how you got on. I too am currently trying to find out more about this software. There are some reviews (+ve) but could do with more info on this one.
Cheers. 😛
The software is easily available (
www.wave59.com) and you can download it for a month's free experimentation. It runs off various data feeds without complex plumbing (eSignal is what I have used) and it looks quite neat. There are still some annoying bugs, like "errors" that keep popping up every time there is a micro glitch in the data feed. However, it is certainly good enough to try.
The Lomb Periodogram is an interesting theoretical attempt to resolve the "cycle v trend" conundrum, first applied in astrophysics and then infantile cardiology. It attempts to plot cycles from irregularly spaced data, and overlays on the cycle an estimate of the probability that the plotted cycle will be incorrect. If the probability of failure rises above a certain threshold, you ignore the cycle trades and trade the trend. The ability to handle irregular data is meant to be an advance over simpler indicators based just on Fast Fourier Transforms, which mathematically assume regularity (which we know does not obtain) and have produced inferior results over the years.
A simple back-test on FTSE data for last week suggested there might be something in the combination of Lomb Periodogram signals with other signals that Wave59 supports (it has a pattern filter for certain candlestick turning points, and a price-cycle counter). The notional results were amazingly good (but what do you expect from a back-test?)
It is also very clear when there is a signal, as the day proceeds, so little slack for interpretation.
However, there is no doubt that the day can be scattered with false signals. Yesterday's trading in the S&P is a case in point.
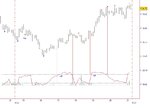
The attached thumbnail shows:
(a) Buy signal at 15.00 London time (price cycle tool, 9 painted below price bar);
(b) Buy signal at 16.00 (price cycle 5);
(c) Lomb sell signal at 17.05 (note curve above upper parallel and absence of significant interference bars from the probability estimator);
(d) Lomb sell signal at 19.00
The cumulative effect of these signals would be about 15pts negative. This does not include the false sell signals at 19.30, 19.55 and 20.20.
On the other pan, you can put the cycle-counter buy signals at 14.45 (+2.5pts) and 16.15 (say 2.75pts before running into the Lomb signal at 17.05)
It is early days for Lomb, but yesterday was not a good day.
By the way, there are also tons of tools for drawing patterns drawn from Gann, Fibonacci, Astrology etc. But I confess that none of these motivated me to look at the package.